| __timestamp | Automatic Data Processing, Inc. | Delta Air Lines, Inc. |
|---|---|---|
| Wednesday, January 1, 2014 | 2762400000 | 2785000000 |
| Thursday, January 1, 2015 | 2496900000 | 3162000000 |
| Friday, January 1, 2016 | 2637000000 | 2825000000 |
| Sunday, January 1, 2017 | 2783200000 | 2892000000 |
| Monday, January 1, 2018 | 2971500000 | 3242000000 |
| Tuesday, January 1, 2019 | 3064200000 | 3636000000 |
| Wednesday, January 1, 2020 | 3003000000 | 582000000 |
| Friday, January 1, 2021 | 3040500000 | 1061000000 |
| Saturday, January 1, 2022 | 3233200000 | 2454000000 |
| Sunday, January 1, 2023 | 3551400000 | 2334000000 |
| Monday, January 1, 2024 | 3778900000 | 2485000000 |
Igniting the spark of knowledge
In the world of corporate finance, Selling, General, and Administrative (SG&A) expenses are a critical measure of operational efficiency. This chart compares the SG&A spending patterns of Automatic Data Processing, Inc. (ADP) and Delta Air Lines, Inc. (DAL) from 2014 to 2024. Over this decade, ADP's SG&A expenses have shown a steady upward trend, increasing by approximately 36% from 2014 to 2024. In contrast, Delta Air Lines experienced a more volatile pattern, with a significant dip in 2020, likely due to the pandemic's impact on the airline industry. By 2024, Delta's SG&A expenses had decreased by about 11% compared to 2019. This divergence highlights the resilience of the tech sector compared to the challenges faced by the airline industry. Understanding these trends can provide valuable insights for investors and industry analysts alike.
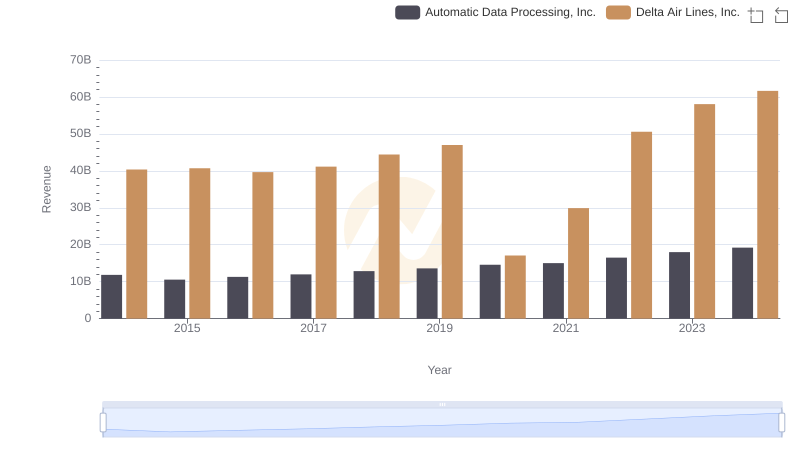
Revenue Showdown: Automatic Data Processing, Inc. vs Delta Air Lines, Inc.
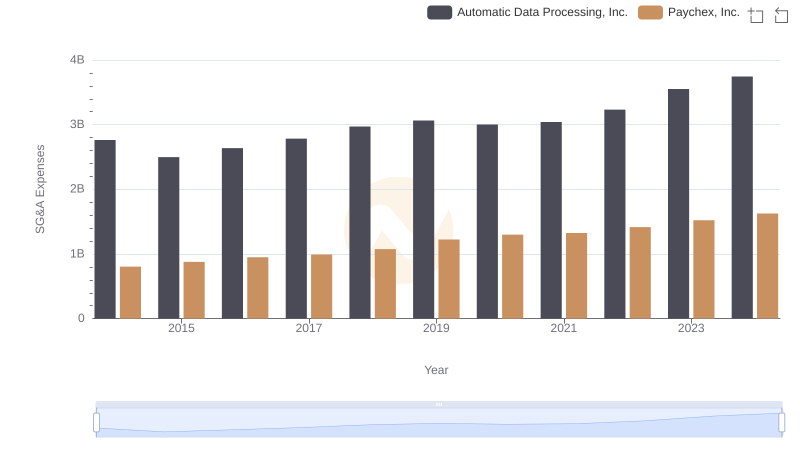
Who Optimizes SG&A Costs Better? Automatic Data Processing, Inc. or Paychex, Inc.
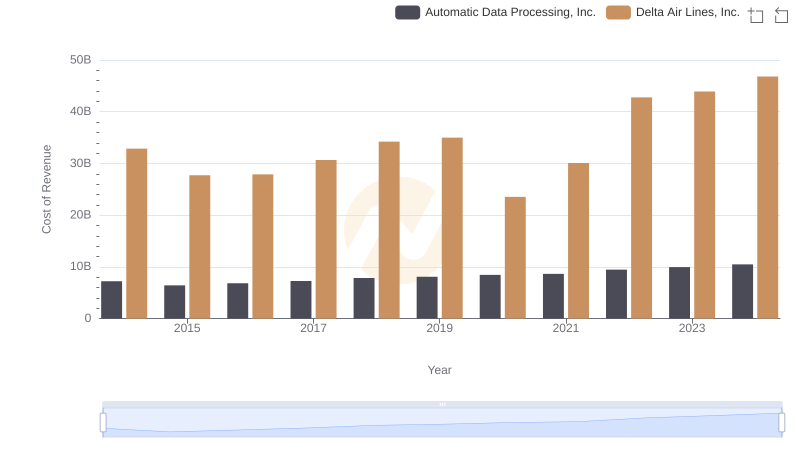
Comparing Cost of Revenue Efficiency: Automatic Data Processing, Inc. vs Delta Air Lines, Inc.
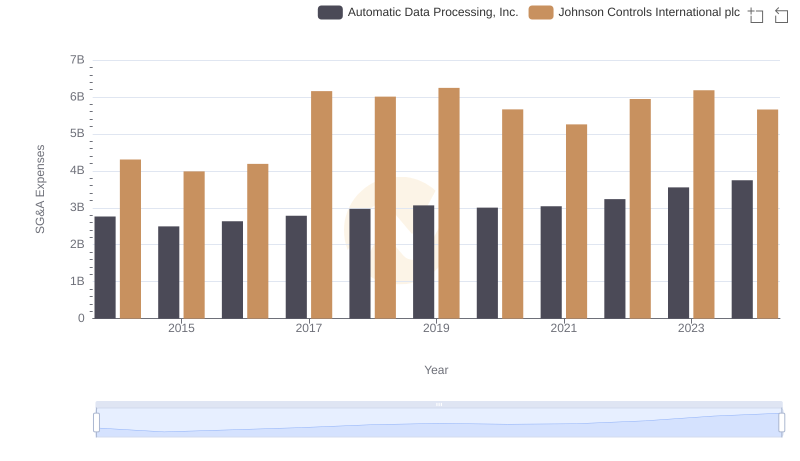
Automatic Data Processing, Inc. or Johnson Controls International plc: Who Manages SG&A Costs Better?
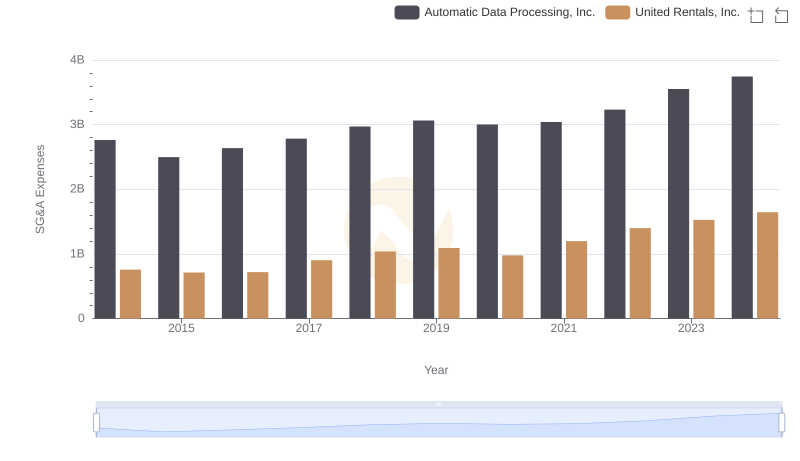
Automatic Data Processing, Inc. or United Rentals, Inc.: Who Manages SG&A Costs Better?
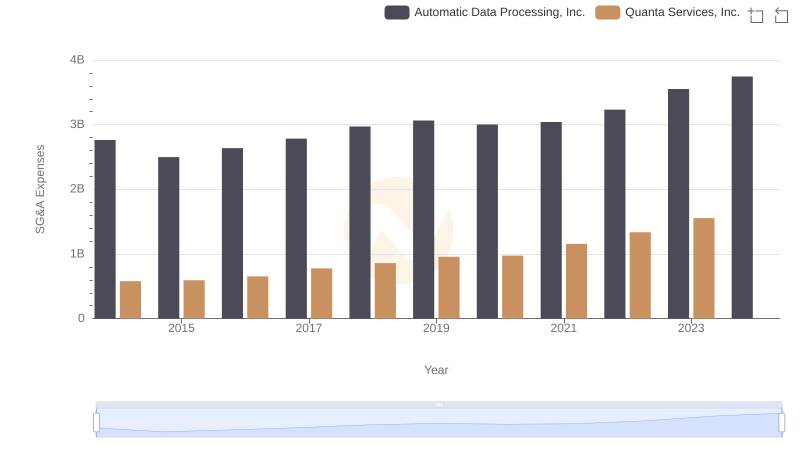
Selling, General, and Administrative Costs: Automatic Data Processing, Inc. vs Quanta Services, Inc.

Automatic Data Processing, Inc. vs Fastenal Company: SG&A Expense Trends