| __timestamp | Eaton Corporation plc | Xylem Inc. |
|---|---|---|
| Wednesday, January 1, 2014 | 3810000000 | 920000000 |
| Thursday, January 1, 2015 | 3596000000 | 854000000 |
| Friday, January 1, 2016 | 3505000000 | 915000000 |
| Sunday, January 1, 2017 | 3565000000 | 1090000000 |
| Monday, January 1, 2018 | 3548000000 | 1161000000 |
| Tuesday, January 1, 2019 | 3583000000 | 1158000000 |
| Wednesday, January 1, 2020 | 3075000000 | 1143000000 |
| Friday, January 1, 2021 | 3256000000 | 1179000000 |
| Saturday, January 1, 2022 | 3227000000 | 1227000000 |
| Sunday, January 1, 2023 | 3795000000 | 1757000000 |
| Monday, January 1, 2024 | 4077000000 |
Unlocking the unknown
In the ever-evolving landscape of industrial giants, understanding the financial dynamics of companies like Eaton Corporation plc and Xylem Inc. is crucial. Over the past decade, from 2014 to 2023, Eaton consistently outpaced Xylem in Selling, General, and Administrative (SG&A) expenses, reflecting its larger operational scale. Eaton's SG&A expenses peaked in 2014 and 2023, with a notable dip in 2020, likely due to global economic disruptions. In contrast, Xylem's expenses showed a steady upward trend, culminating in a significant 52% increase from 2014 to 2023. This growth trajectory highlights Xylem's expanding market presence and strategic investments. As we delve into these financial narratives, it becomes evident that while Eaton maintains a robust lead, Xylem's agile growth strategy positions it as a formidable contender in the industrial sector.
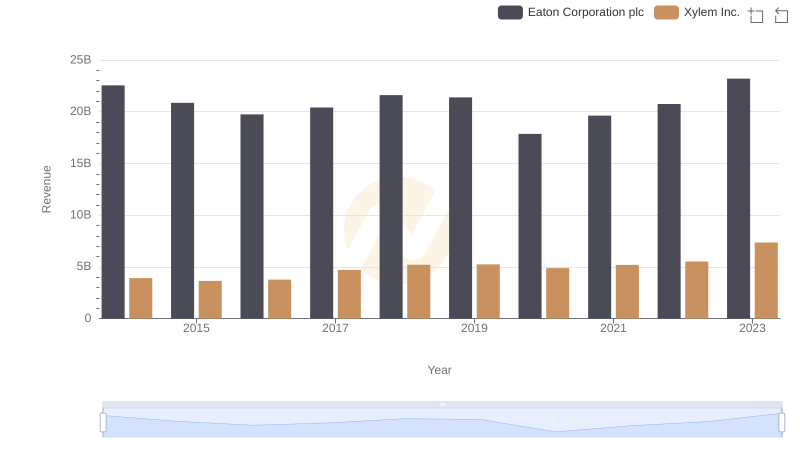
Revenue Insights: Eaton Corporation plc and Xylem Inc. Performance Compared
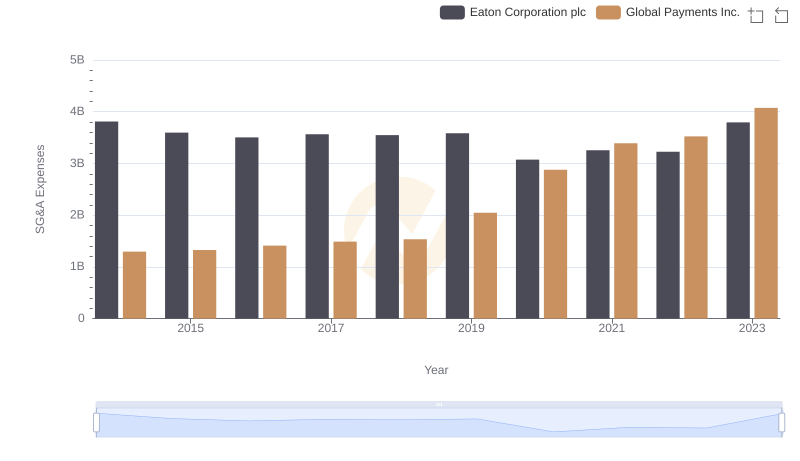
Cost Management Insights: SG&A Expenses for Eaton Corporation plc and Global Payments Inc.
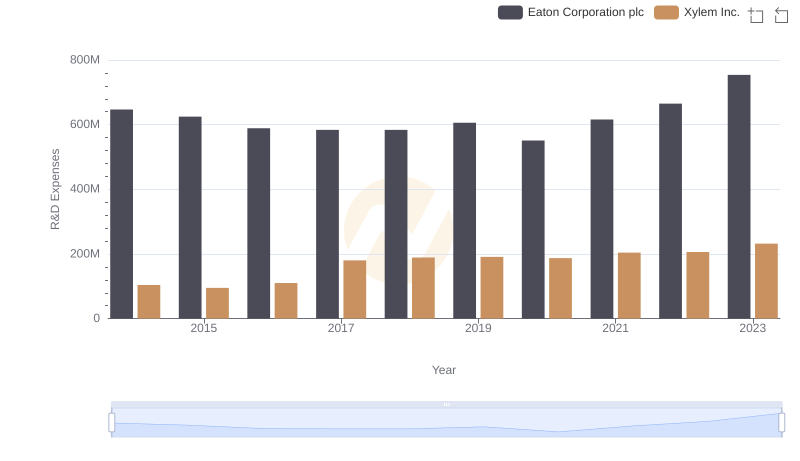
Research and Development Investment: Eaton Corporation plc vs Xylem Inc.
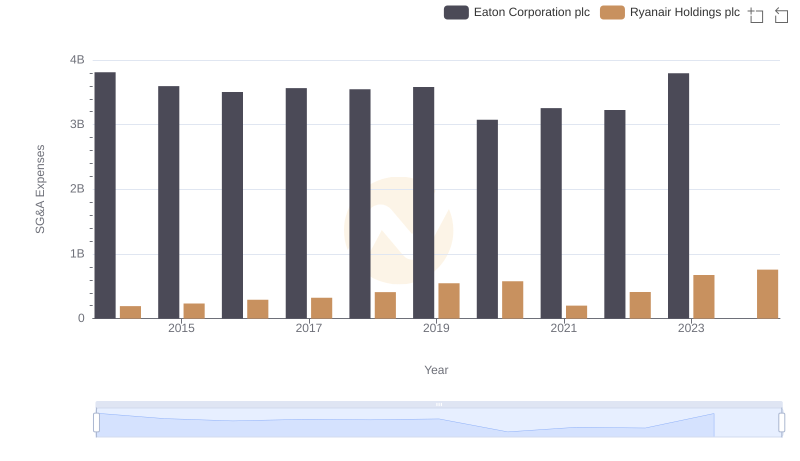
Operational Costs Compared: SG&A Analysis of Eaton Corporation plc and Ryanair Holdings plc
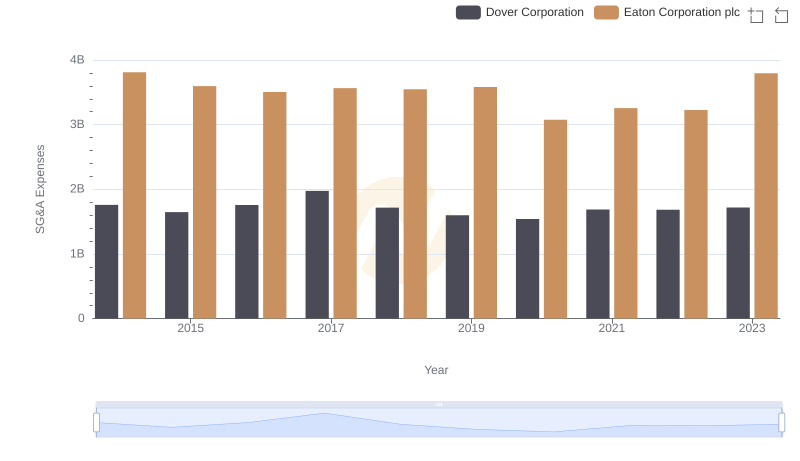
Comparing SG&A Expenses: Eaton Corporation plc vs Dover Corporation Trends and Insights
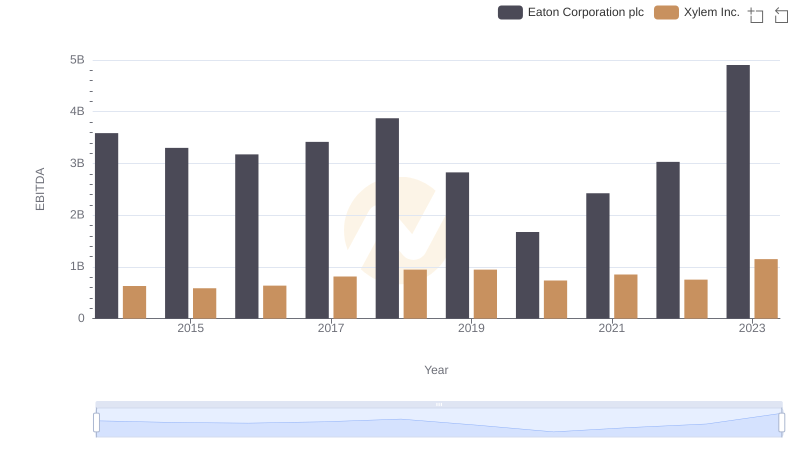
Comparative EBITDA Analysis: Eaton Corporation plc vs Xylem Inc.
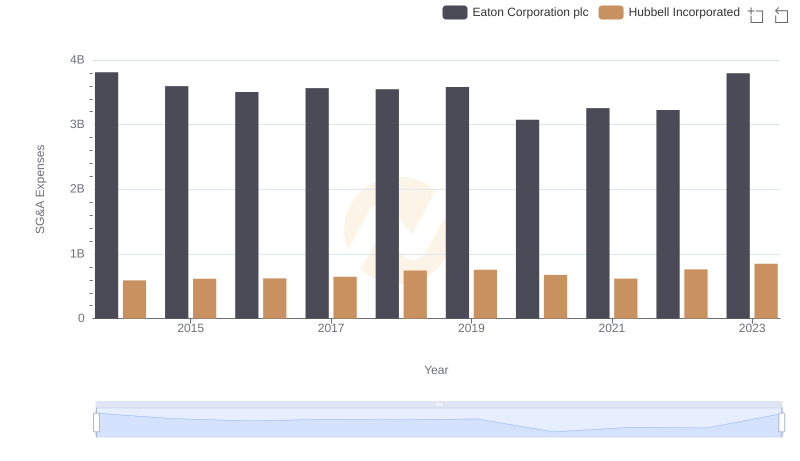
Operational Costs Compared: SG&A Analysis of Eaton Corporation plc and Hubbell Incorporated