| __timestamp | Eaton Corporation plc | Xylem Inc. |
|---|---|---|
| Wednesday, January 1, 2014 | 3586000000 | 631000000 |
| Thursday, January 1, 2015 | 3302000000 | 588000000 |
| Friday, January 1, 2016 | 3176000000 | 637000000 |
| Sunday, January 1, 2017 | 3418000000 | 814000000 |
| Monday, January 1, 2018 | 3875000000 | 948000000 |
| Tuesday, January 1, 2019 | 2827000000 | 947000000 |
| Wednesday, January 1, 2020 | 1674000000 | 736000000 |
| Friday, January 1, 2021 | 2423000000 | 853000000 |
| Saturday, January 1, 2022 | 3031000000 | 755000000 |
| Sunday, January 1, 2023 | 4904000000 | 1150000000 |
| Monday, January 1, 2024 | 5547999771 |
Infusing magic into the data realm
In the ever-evolving landscape of industrial giants, Eaton Corporation plc and Xylem Inc. have showcased intriguing financial trajectories over the past decade. From 2014 to 2023, Eaton's EBITDA has seen a remarkable 37% increase, peaking in 2023 with a 49% surge from the previous year. This growth underscores Eaton's resilience and strategic prowess in navigating market challenges.
Conversely, Xylem Inc. has demonstrated steady growth, with its EBITDA rising by 83% over the same period. Notably, Xylem's EBITDA in 2023 reached its highest point, marking a 53% increase from 2020, a testament to its robust operational strategies and market adaptability.
This comparative analysis not only highlights the financial health of these corporations but also offers insights into their strategic directions. As the industrial sector continues to evolve, these companies remain pivotal players, shaping the future of sustainable solutions.
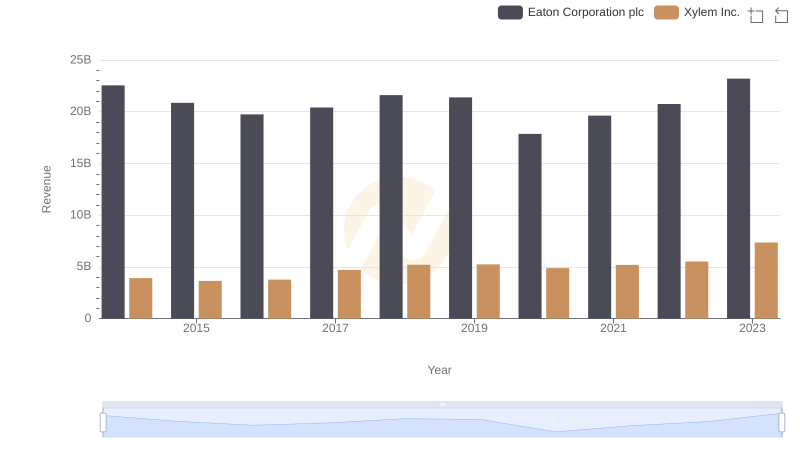
Revenue Insights: Eaton Corporation plc and Xylem Inc. Performance Compared
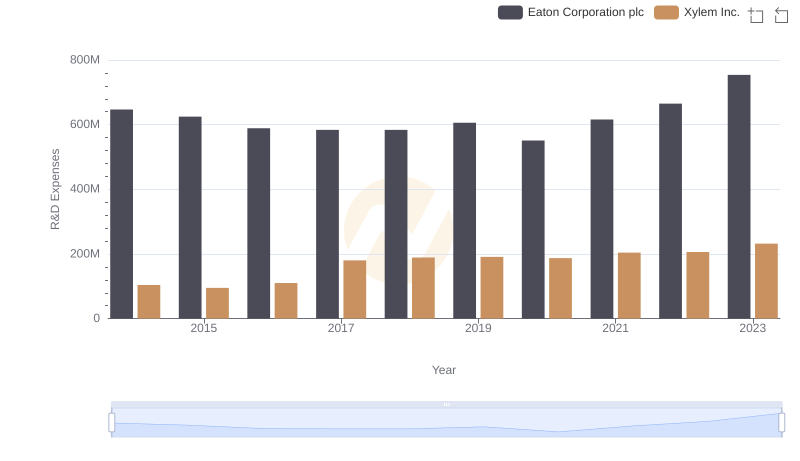
Research and Development Investment: Eaton Corporation plc vs Xylem Inc.
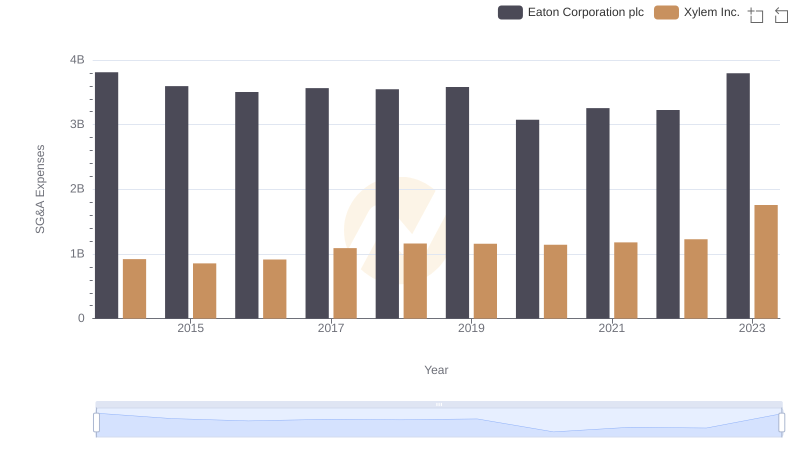
Breaking Down SG&A Expenses: Eaton Corporation plc vs Xylem Inc.
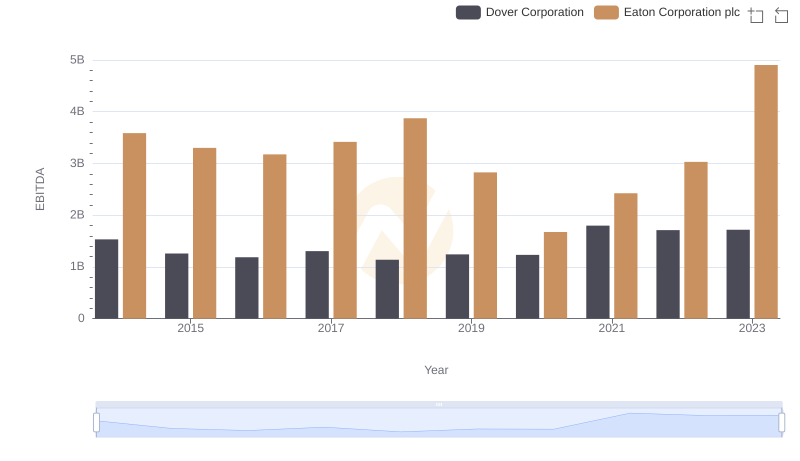
Comparative EBITDA Analysis: Eaton Corporation plc vs Dover Corporation
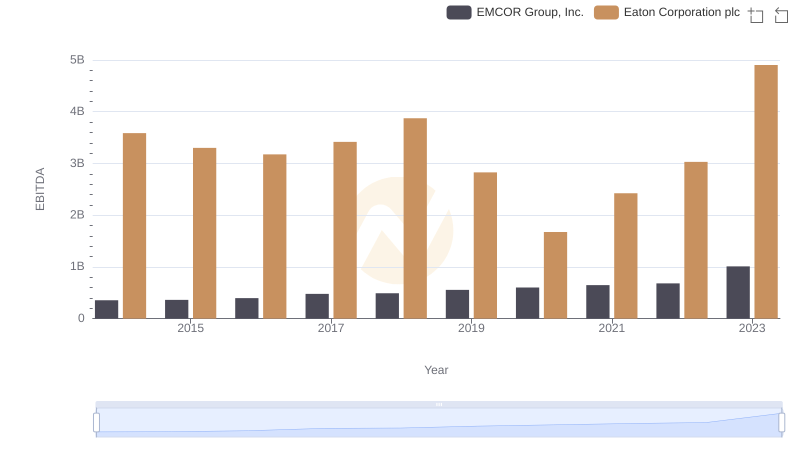
Eaton Corporation plc and EMCOR Group, Inc.: A Detailed Examination of EBITDA Performance