| __timestamp | Eaton Corporation plc | Global Payments Inc. |
|---|---|---|
| Wednesday, January 1, 2014 | 3810000000 | 1295014000 |
| Thursday, January 1, 2015 | 3596000000 | 1325567000 |
| Friday, January 1, 2016 | 3505000000 | 1411096000 |
| Sunday, January 1, 2017 | 3565000000 | 1488258000 |
| Monday, January 1, 2018 | 3548000000 | 1534297000 |
| Tuesday, January 1, 2019 | 3583000000 | 2046672000 |
| Wednesday, January 1, 2020 | 3075000000 | 2878878000 |
| Friday, January 1, 2021 | 3256000000 | 3391161000 |
| Saturday, January 1, 2022 | 3227000000 | 3524578000 |
| Sunday, January 1, 2023 | 3795000000 | 4073768000 |
| Monday, January 1, 2024 | 4077000000 | 4285307000 |
Igniting the spark of knowledge
In the ever-evolving landscape of corporate finance, understanding cost management is crucial. This analysis delves into the Selling, General, and Administrative (SG&A) expenses of Eaton Corporation plc and Global Payments Inc. over the past decade. From 2014 to 2023, Eaton Corporation plc's SG&A expenses have shown a slight decline, with a notable dip in 2020, reflecting a 19% decrease from the previous year. However, by 2023, they rebounded to nearly 3.8 billion, indicating a strategic recovery. In contrast, Global Payments Inc. has experienced a significant upward trend, with expenses surging by over 200% from 2014 to 2023. This growth highlights the company's expansion and increased operational activities. Such insights are invaluable for investors and analysts seeking to understand the financial health and strategic direction of these industry giants.
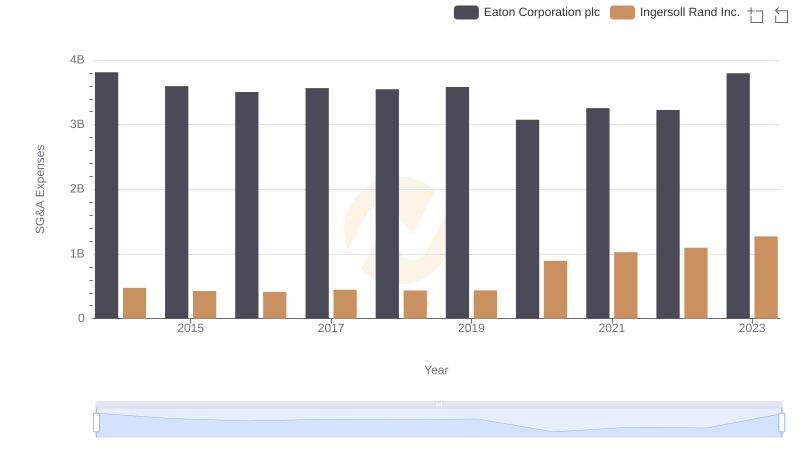
Operational Costs Compared: SG&A Analysis of Eaton Corporation plc and Ingersoll Rand Inc.
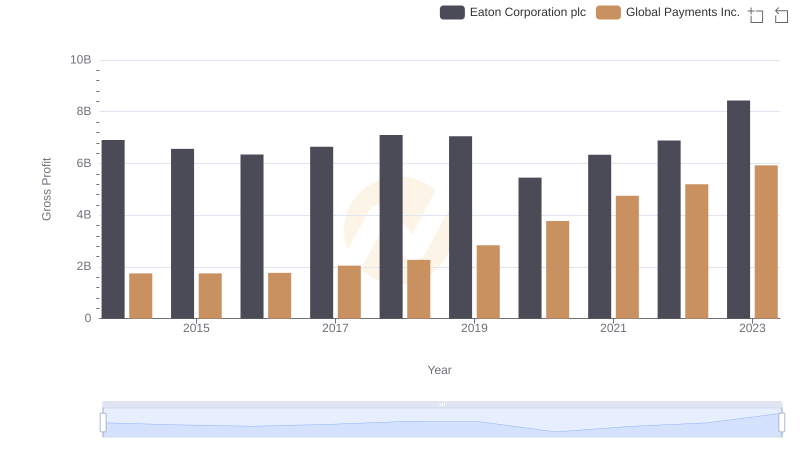
Gross Profit Analysis: Comparing Eaton Corporation plc and Global Payments Inc.
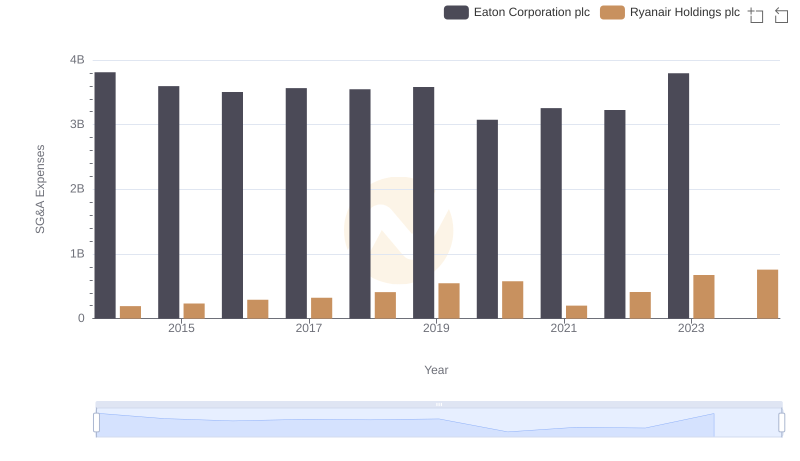
Operational Costs Compared: SG&A Analysis of Eaton Corporation plc and Ryanair Holdings plc
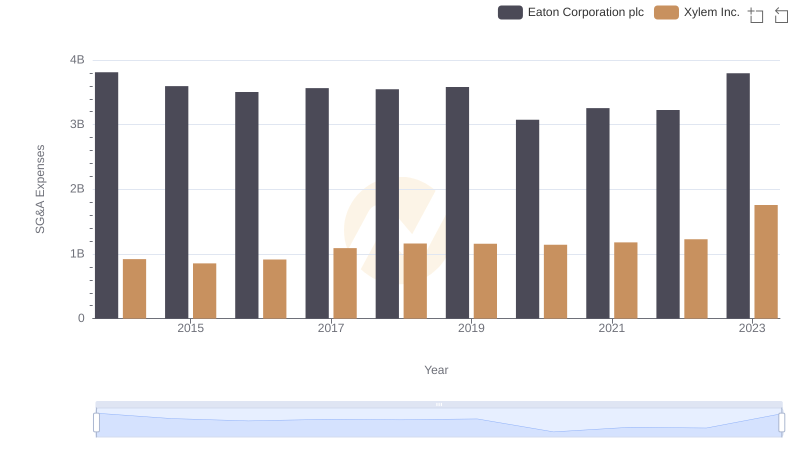
Breaking Down SG&A Expenses: Eaton Corporation plc vs Xylem Inc.