| __timestamp | Graco Inc. | Watsco, Inc. |
|---|---|---|
| Wednesday, January 1, 2014 | 1221130000 | 3944540000 |
| Thursday, January 1, 2015 | 1286485000 | 4113239000 |
| Friday, January 1, 2016 | 1329293000 | 4220702000 |
| Sunday, January 1, 2017 | 1474744000 | 4341955000 |
| Monday, January 1, 2018 | 1653292000 | 4546653000 |
| Tuesday, January 1, 2019 | 1646045000 | 4770362000 |
| Wednesday, January 1, 2020 | 1650115000 | 5054928000 |
| Friday, January 1, 2021 | 1987608000 | 6280192000 |
| Saturday, January 1, 2022 | 2143521000 | 7274344000 |
| Sunday, January 1, 2023 | 2195606000 | 7283767000 |
| Monday, January 1, 2024 | 2113316000 | 7618317000 |
Unlocking the unknown
In the competitive landscape of industrial giants, Watsco, Inc. and Graco Inc. have been vying for the top spot in yearly revenue since 2014. Over the past decade, Watsco, Inc. has consistently outperformed Graco Inc., with revenues peaking at approximately 7.3 billion in 2023, a staggering 230% increase from 2014. In contrast, Graco Inc. has shown steady growth, reaching around 2.2 billion in 2023, marking an 80% rise over the same period. This impressive growth trajectory highlights Watsco's dominance in the market, driven by strategic expansions and robust demand in the HVAC industry. Meanwhile, Graco's steady climb underscores its resilience and innovation in fluid handling systems. As we look to the future, the absence of 2024 data for Watsco, Inc. leaves room for speculation on whether Graco Inc. can close the gap.
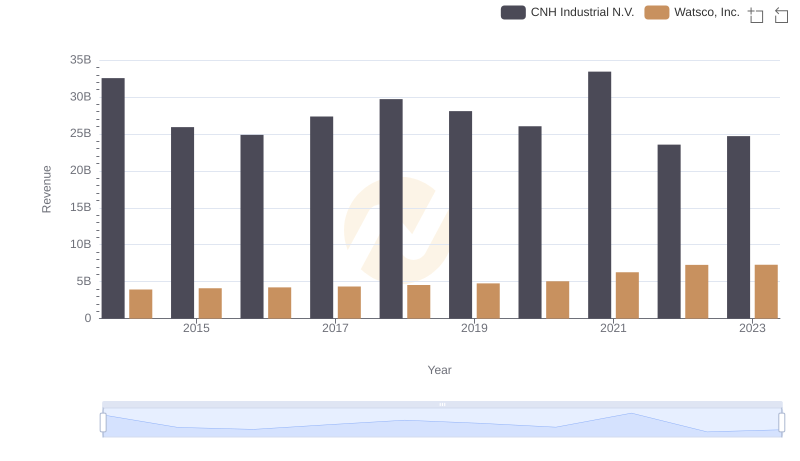
Comparing Revenue Performance: Watsco, Inc. or CNH Industrial N.V.?
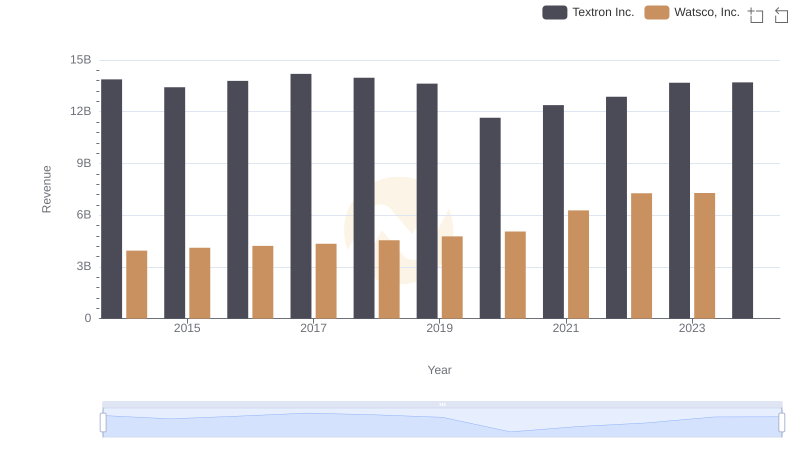
Breaking Down Revenue Trends: Watsco, Inc. vs Textron Inc.
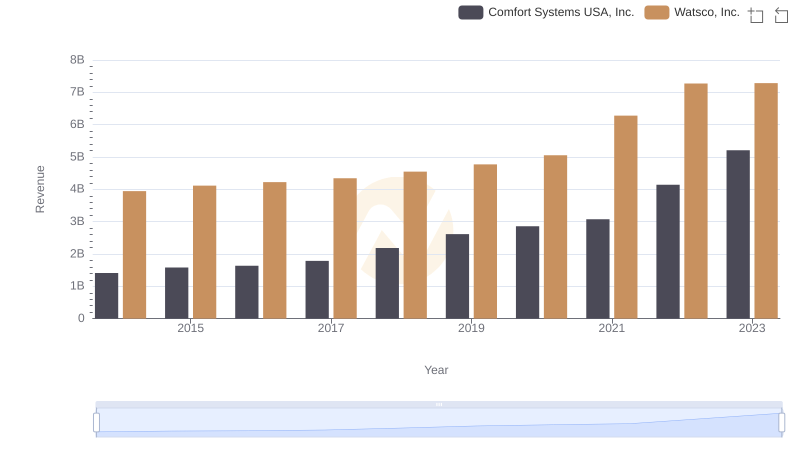
Watsco, Inc. or Comfort Systems USA, Inc.: Who Leads in Yearly Revenue?
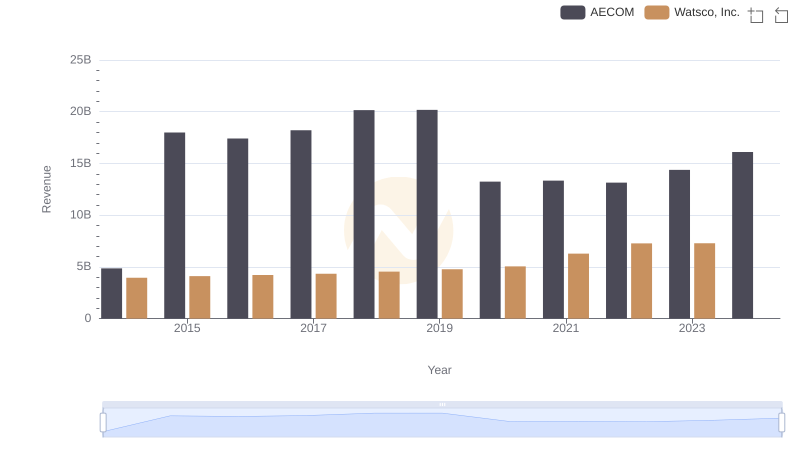
Watsco, Inc. vs AECOM: Annual Revenue Growth Compared
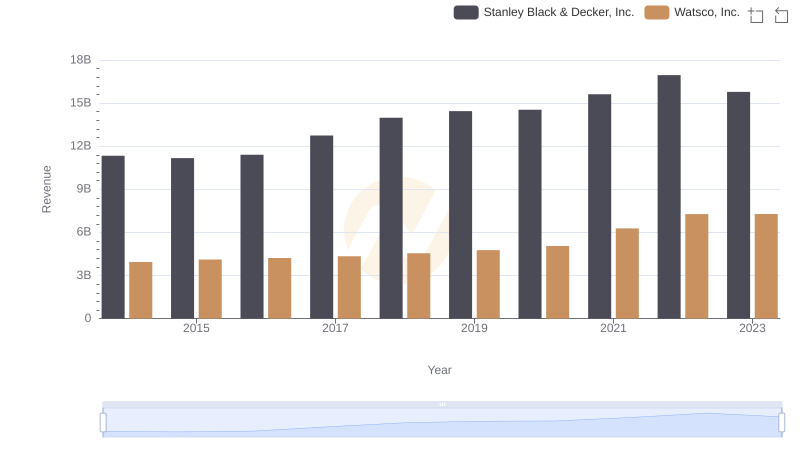
Who Generates More Revenue? Watsco, Inc. or Stanley Black & Decker, Inc.
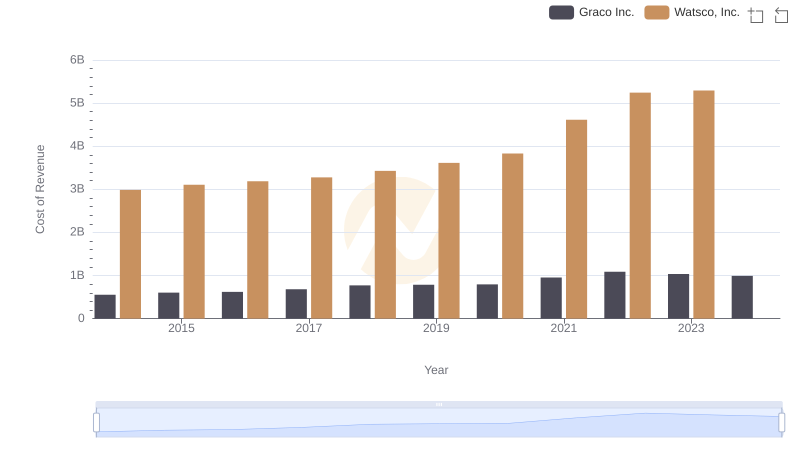
Analyzing Cost of Revenue: Watsco, Inc. and Graco Inc.
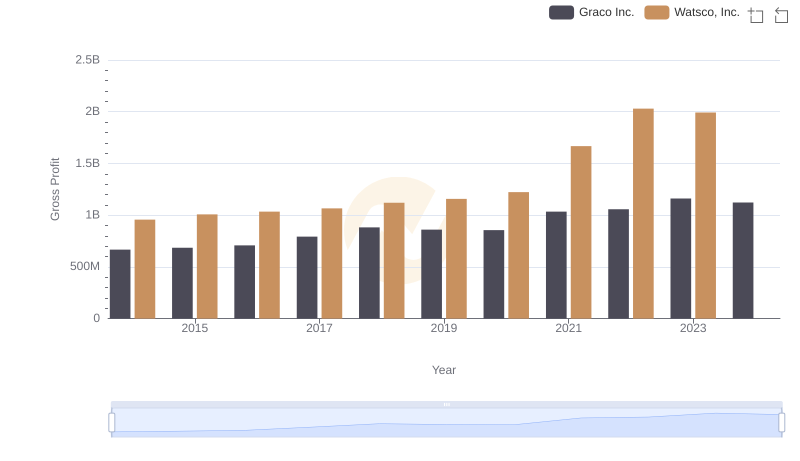
Who Generates Higher Gross Profit? Watsco, Inc. or Graco Inc.
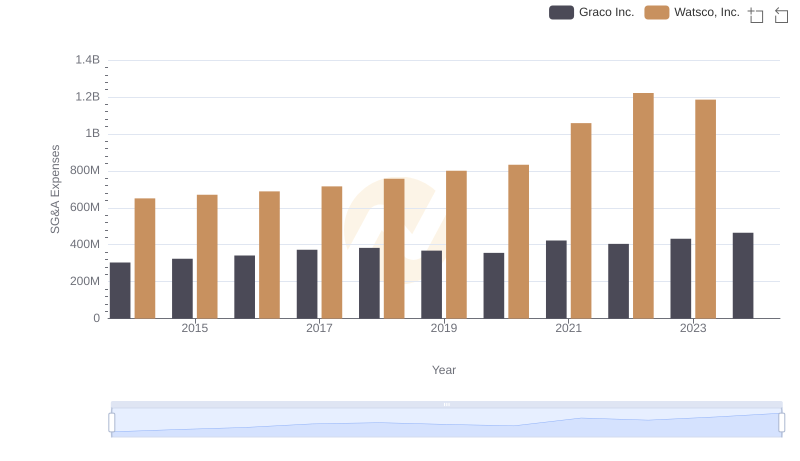
Watsco, Inc. or Graco Inc.: Who Manages SG&A Costs Better?
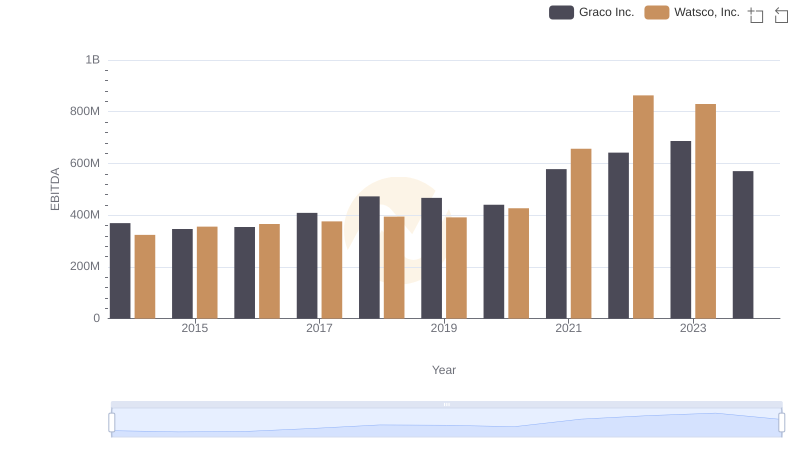
Watsco, Inc. vs Graco Inc.: In-Depth EBITDA Performance Comparison