| __timestamp | Ingersoll Rand Inc. | RB Global, Inc. |
|---|---|---|
| Wednesday, January 1, 2014 | 936781000 | 423213000 |
| Thursday, January 1, 2015 | 779100000 | 459849000 |
| Friday, January 1, 2016 | 716731000 | 500333000 |
| Sunday, January 1, 2017 | 897900000 | 531504000 |
| Monday, January 1, 2018 | 1012500000 | 636629000 |
| Tuesday, January 1, 2019 | 911700000 | 672825000 |
| Wednesday, January 1, 2020 | 1613400000 | 761671000 |
| Friday, January 1, 2021 | 1988500000 | 822188000 |
| Saturday, January 1, 2022 | 2325600000 | 957107000 |
| Sunday, January 1, 2023 | 2882200000 | 1778400000 |
| Monday, January 1, 2024 | 0 | 4284200000 |
Cracking the code
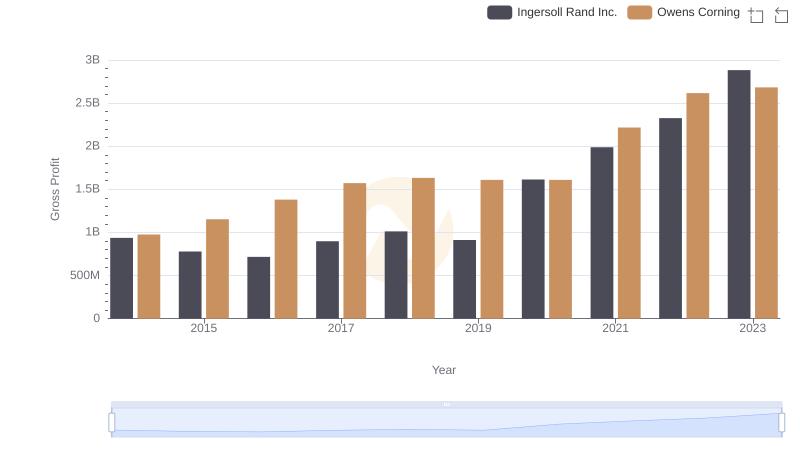
In the ever-evolving landscape of industrial and global markets, understanding financial performance is crucial. This analysis delves into the gross profit trends of two industry giants: Ingersoll Rand Inc. and RB Global, Inc., from 2014 to 2023. Over this period, Ingersoll Rand Inc. has demonstrated a robust growth trajectory, with its gross profit surging by approximately 207%, from $937 million in 2014 to nearly $2.9 billion in 2023. In contrast, RB Global, Inc. has also shown commendable growth, with its gross profit increasing by around 320%, from $423 million to $1.78 billion in the same timeframe.
The data reveals a consistent upward trend for both companies, highlighting their resilience and adaptability in a competitive market. This financial insight not only underscores the companies' strategic prowess but also offers a glimpse into the broader economic trends influencing the industrial sector.
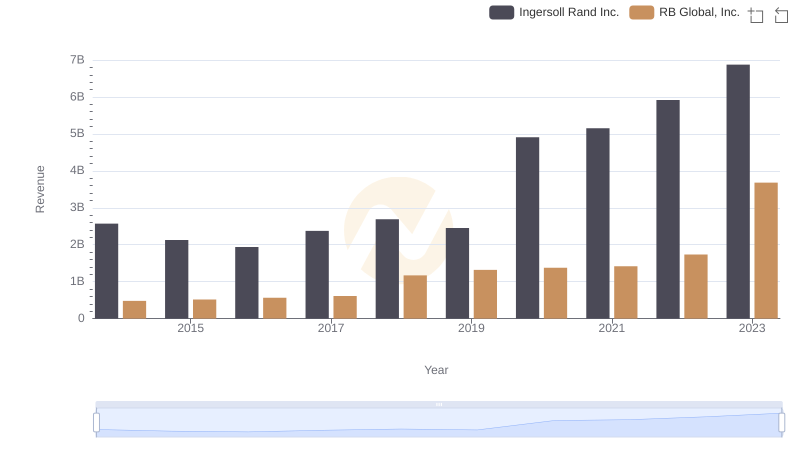
Breaking Down Revenue Trends: Ingersoll Rand Inc. vs RB Global, Inc.
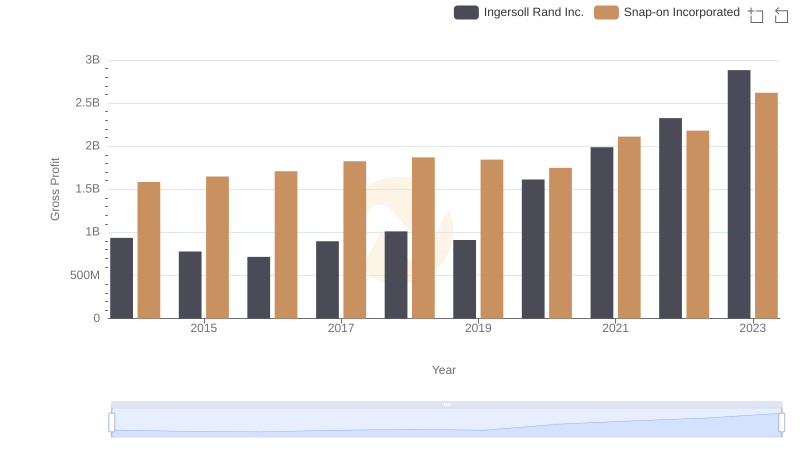
Key Insights on Gross Profit: Ingersoll Rand Inc. vs Snap-on Incorporated
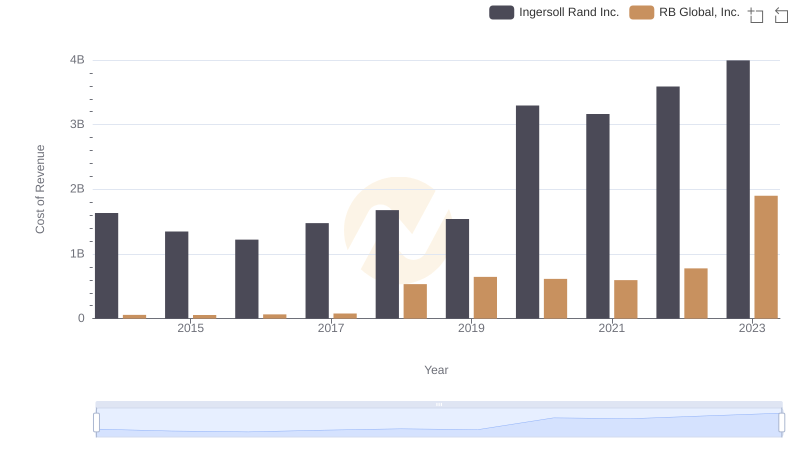
Analyzing Cost of Revenue: Ingersoll Rand Inc. and RB Global, Inc.
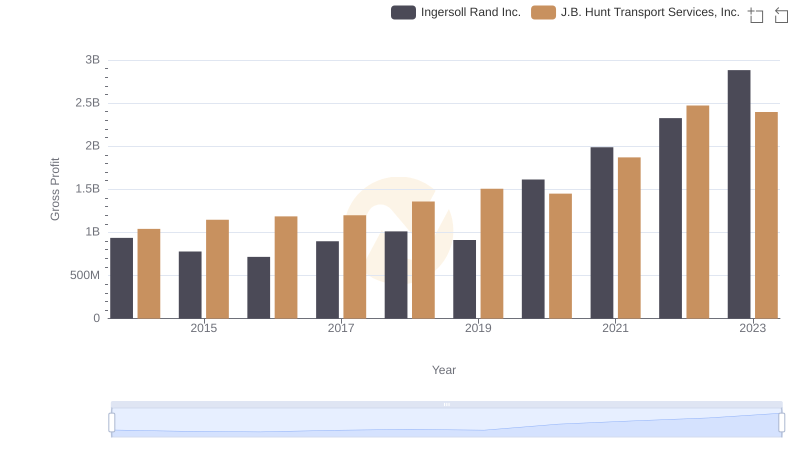
Gross Profit Comparison: Ingersoll Rand Inc. and J.B. Hunt Transport Services, Inc. Trends
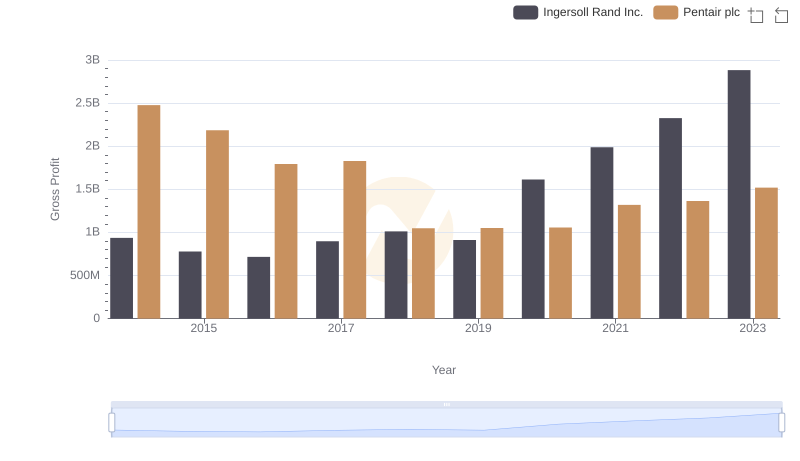
Ingersoll Rand Inc. vs Pentair plc: A Gross Profit Performance Breakdown
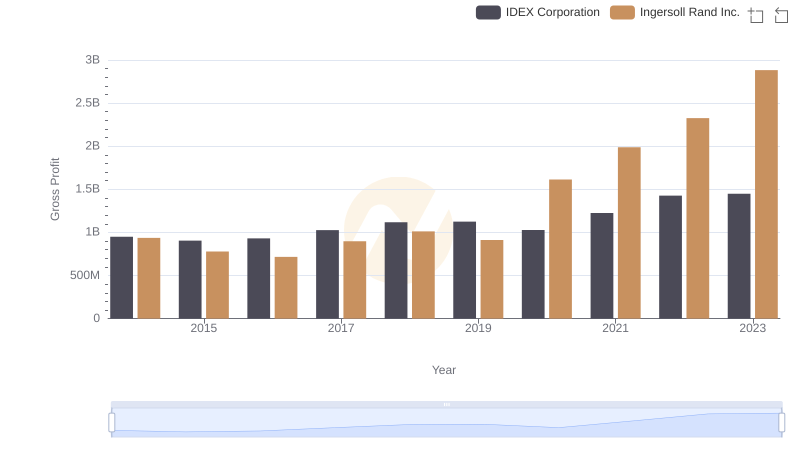
Gross Profit Analysis: Comparing Ingersoll Rand Inc. and IDEX Corporation
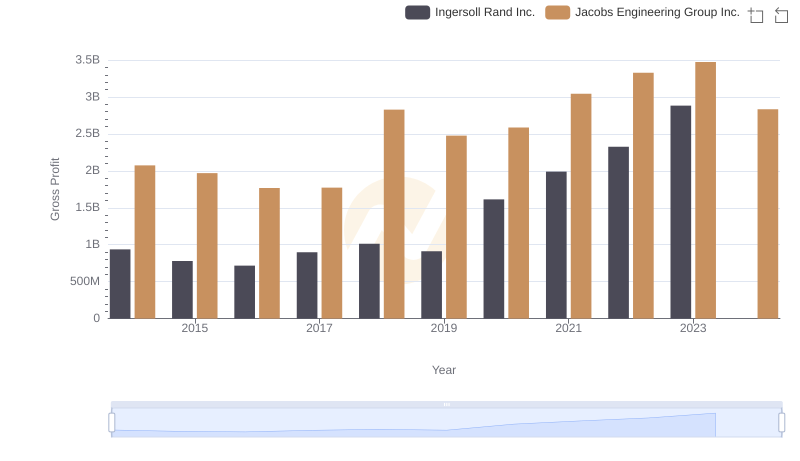
Ingersoll Rand Inc. vs Jacobs Engineering Group Inc.: A Gross Profit Performance Breakdown
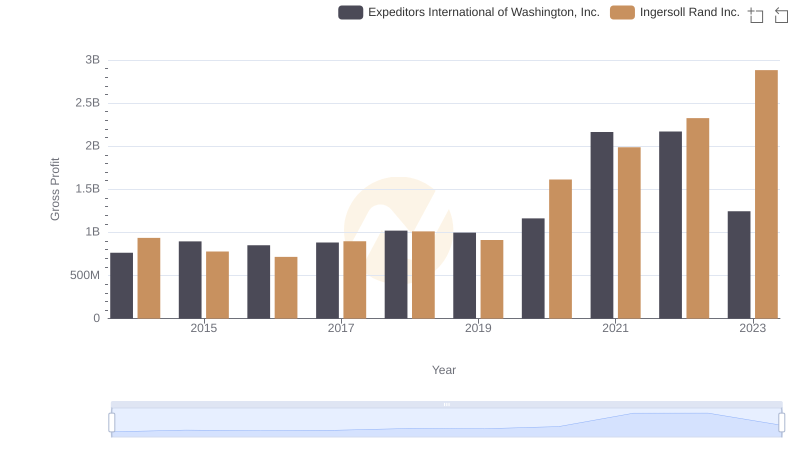
Who Generates Higher Gross Profit? Ingersoll Rand Inc. or Expeditors International of Washington, Inc.
Who Generates Higher Gross Profit? Ingersoll Rand Inc. or Owens Corning