| __timestamp | Eaton Corporation plc | Jacobs Engineering Group Inc. |
|---|---|---|
| Wednesday, January 1, 2014 | 3810000000 | 1545716000 |
| Thursday, January 1, 2015 | 3596000000 | 1522811000 |
| Friday, January 1, 2016 | 3505000000 | 1429233000 |
| Sunday, January 1, 2017 | 3565000000 | 1379983000 |
| Monday, January 1, 2018 | 3548000000 | 2180399000 |
| Tuesday, January 1, 2019 | 3583000000 | 2072177000 |
| Wednesday, January 1, 2020 | 3075000000 | 2050695000 |
| Friday, January 1, 2021 | 3256000000 | 2355683000 |
| Saturday, January 1, 2022 | 3227000000 | 2409190000 |
| Sunday, January 1, 2023 | 3795000000 | 2398078000 |
| Monday, January 1, 2024 | 4077000000 | 2140320000 |
Data in motion
In the ever-evolving landscape of industrial giants, Eaton Corporation plc and Jacobs Engineering Group Inc. have showcased intriguing trends in their Selling, General, and Administrative (SG&A) expenses over the past decade. From 2014 to 2023, Eaton's SG&A expenses have fluctuated, peaking in 2014 and 2023, with a notable dip in 2020. This reflects a strategic shift, possibly influenced by global economic conditions and internal restructuring. Meanwhile, Jacobs Engineering has demonstrated a steady upward trajectory, with expenses increasing by approximately 55% from 2014 to 2023, indicating robust growth and expansion efforts.
The data reveals a fascinating narrative of resilience and adaptation, with Eaton's expenses showing a 15% decrease from 2014 to 2020, before rebounding. Jacobs, on the other hand, maintained a consistent rise, underscoring its aggressive market positioning. Missing data for Eaton in 2024 suggests potential reporting delays or strategic changes, adding another layer of intrigue to this financial saga.
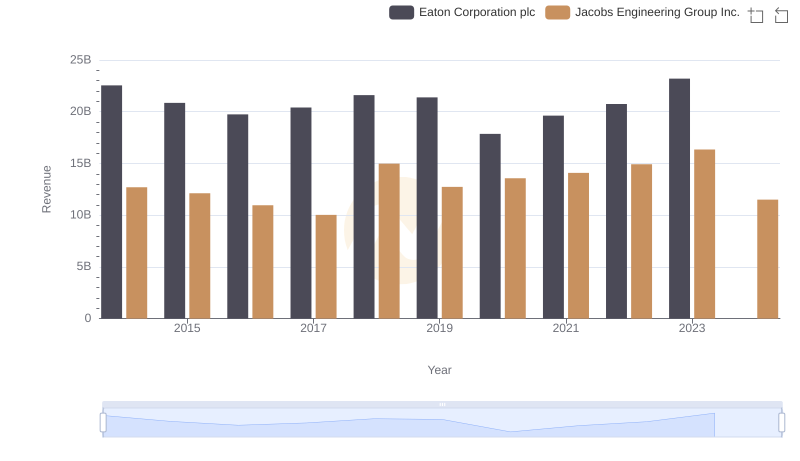
Breaking Down Revenue Trends: Eaton Corporation plc vs Jacobs Engineering Group Inc.
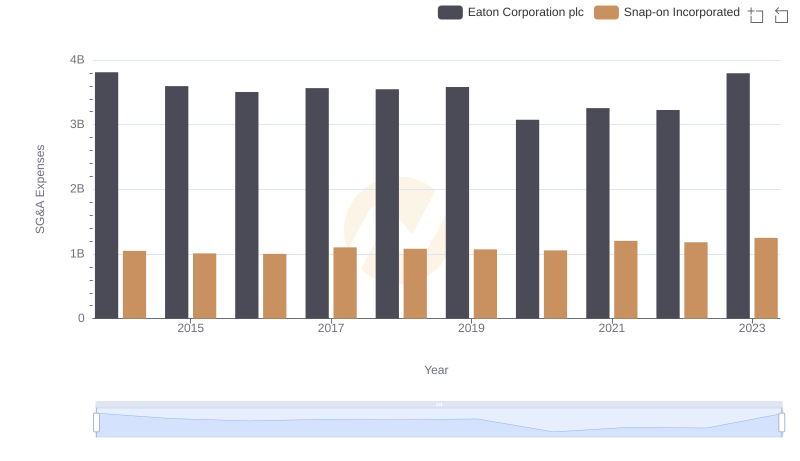
SG&A Efficiency Analysis: Comparing Eaton Corporation plc and Snap-on Incorporated
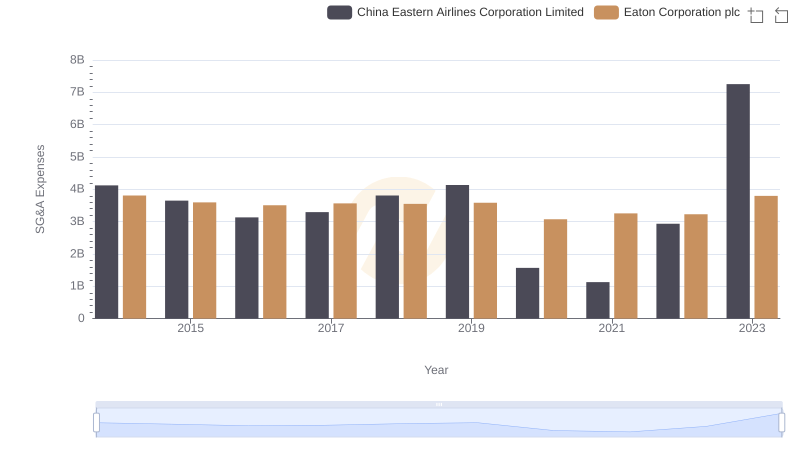
Eaton Corporation plc vs China Eastern Airlines Corporation Limited: SG&A Expense Trends
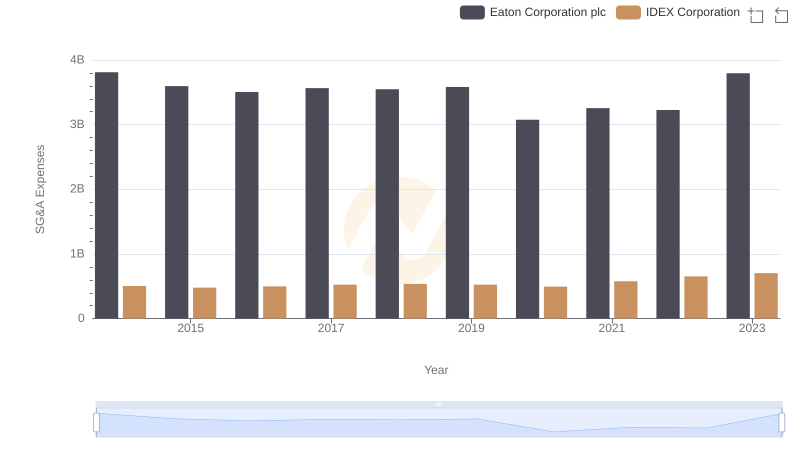
Selling, General, and Administrative Costs: Eaton Corporation plc vs IDEX Corporation
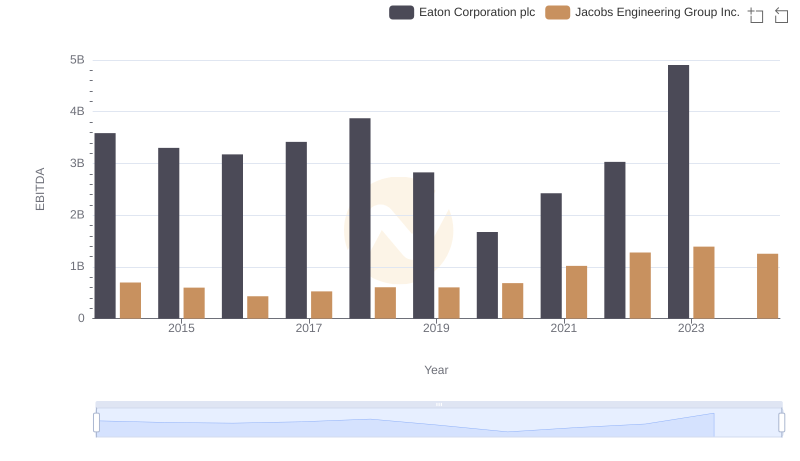
EBITDA Metrics Evaluated: Eaton Corporation plc vs Jacobs Engineering Group Inc.