| __timestamp | Eaton Corporation plc | Jacobs Engineering Group Inc. |
|---|---|---|
| Wednesday, January 1, 2014 | 3586000000 | 699015000 |
| Thursday, January 1, 2015 | 3302000000 | 598932000 |
| Friday, January 1, 2016 | 3176000000 | 431954000 |
| Sunday, January 1, 2017 | 3418000000 | 527765000 |
| Monday, January 1, 2018 | 3875000000 | 606328000 |
| Tuesday, January 1, 2019 | 2827000000 | 604075000 |
| Wednesday, January 1, 2020 | 1674000000 | 685042000 |
| Friday, January 1, 2021 | 2423000000 | 1019116000 |
| Saturday, January 1, 2022 | 3031000000 | 1277649000 |
| Sunday, January 1, 2023 | 4904000000 | 1392039000 |
| Monday, January 1, 2024 | 5547999771 | 1255083000 |
Cracking the code
In the ever-evolving landscape of industrial giants, Eaton Corporation plc and Jacobs Engineering Group Inc. have carved distinct paths. Over the past decade, Eaton's EBITDA has shown a robust upward trajectory, peaking in 2023 with a remarkable 54% increase from its 2014 figures. This growth underscores Eaton's strategic prowess in optimizing operational efficiencies and expanding its market footprint.
Conversely, Jacobs Engineering has demonstrated steady growth, with its EBITDA rising by approximately 99% from 2014 to 2023. This consistent performance highlights Jacobs' resilience and adaptability in a competitive market.
While Eaton's data for 2024 remains elusive, Jacobs continues to project strength with a slight dip from its 2023 peak. As these industry titans forge ahead, their financial narratives offer valuable insights into the dynamics of industrial leadership and innovation.
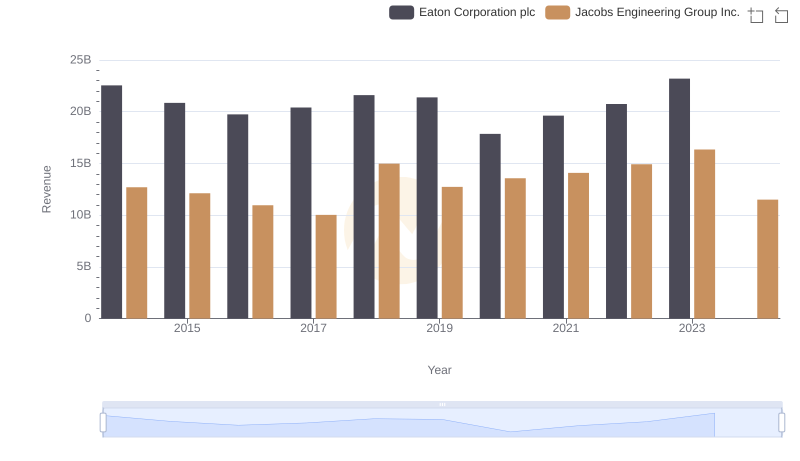
Breaking Down Revenue Trends: Eaton Corporation plc vs Jacobs Engineering Group Inc.
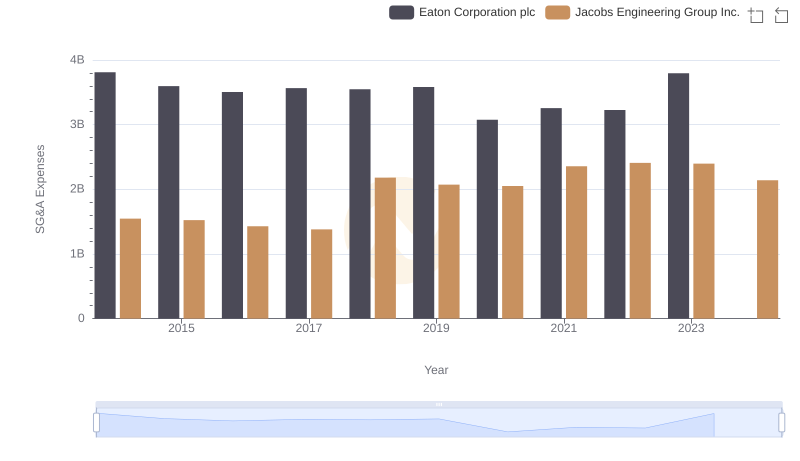
Eaton Corporation plc vs Jacobs Engineering Group Inc.: SG&A Expense Trends
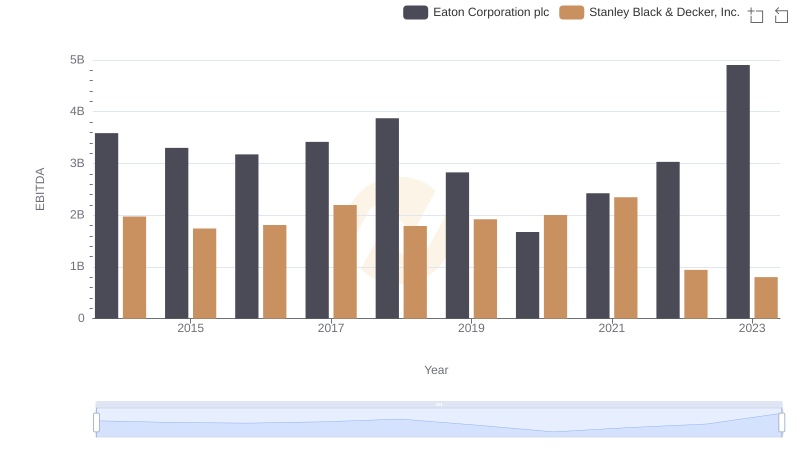
Professional EBITDA Benchmarking: Eaton Corporation plc vs Stanley Black & Decker, Inc.
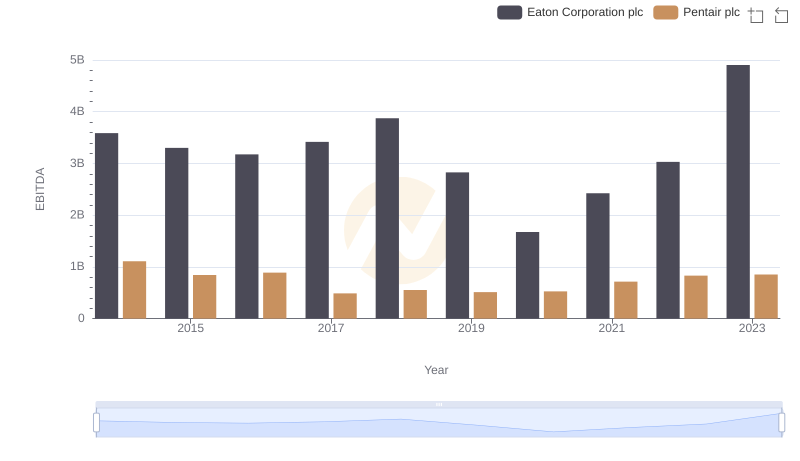
Eaton Corporation plc and Pentair plc: A Detailed Examination of EBITDA Performance
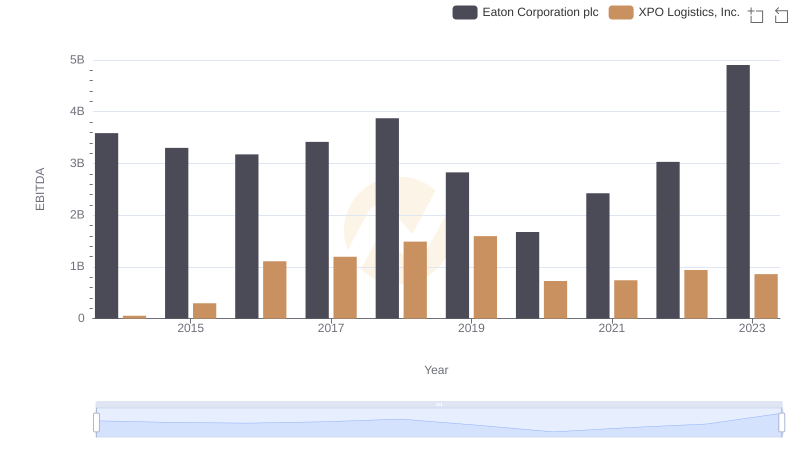
Comprehensive EBITDA Comparison: Eaton Corporation plc vs XPO Logistics, Inc.