| __timestamp | Eaton Corporation plc | Ingersoll Rand Inc. |
|---|---|---|
| Wednesday, January 1, 2014 | 3810000000 | 476000000 |
| Thursday, January 1, 2015 | 3596000000 | 427000000 |
| Friday, January 1, 2016 | 3505000000 | 414339000 |
| Sunday, January 1, 2017 | 3565000000 | 446600000 |
| Monday, January 1, 2018 | 3548000000 | 434600000 |
| Tuesday, January 1, 2019 | 3583000000 | 436400000 |
| Wednesday, January 1, 2020 | 3075000000 | 894800000 |
| Friday, January 1, 2021 | 3256000000 | 1028000000 |
| Saturday, January 1, 2022 | 3227000000 | 1095800000 |
| Sunday, January 1, 2023 | 3795000000 | 1272700000 |
| Monday, January 1, 2024 | 4077000000 | 0 |
Unleashing insights
In the ever-evolving landscape of industrial giants, Eaton Corporation plc and Ingersoll Rand Inc. have showcased intriguing trends in their Selling, General, and Administrative (SG&A) expenses over the past decade. From 2014 to 2023, Eaton consistently maintained higher SG&A expenses, peaking at approximately $3.8 billion in 2014 and 2023. In contrast, Ingersoll Rand's expenses, though significantly lower, demonstrated a remarkable growth trajectory, surging from around $476 million in 2014 to $1.27 billion in 2023, marking a 167% increase.
These insights offer a window into the strategic priorities and operational efficiencies of these industrial leaders.

Breaking Down Revenue Trends: Eaton Corporation plc vs Ingersoll Rand Inc.
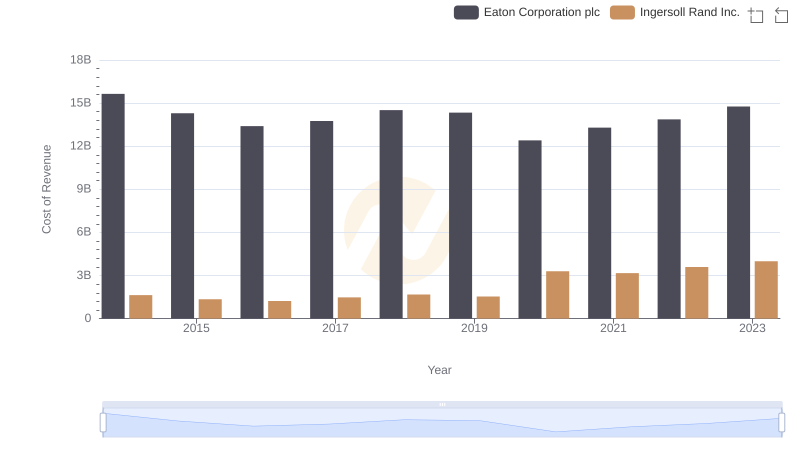
Cost of Revenue Trends: Eaton Corporation plc vs Ingersoll Rand Inc.
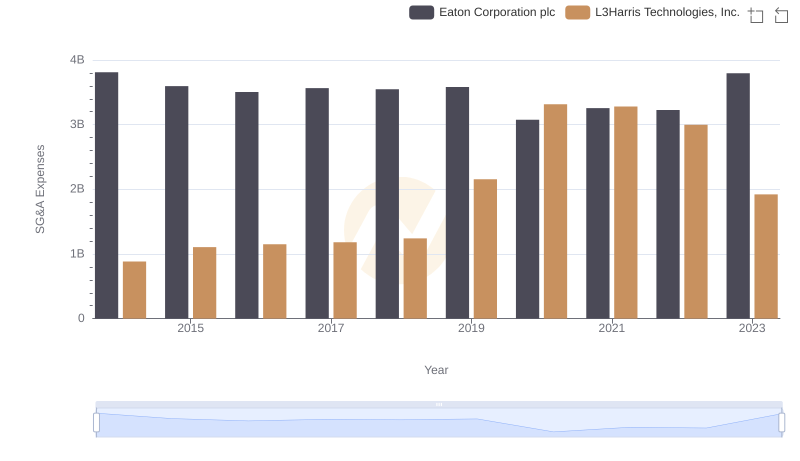
Who Optimizes SG&A Costs Better? Eaton Corporation plc or L3Harris Technologies, Inc.

Research and Development Expenses Breakdown: Eaton Corporation plc vs Ingersoll Rand Inc.
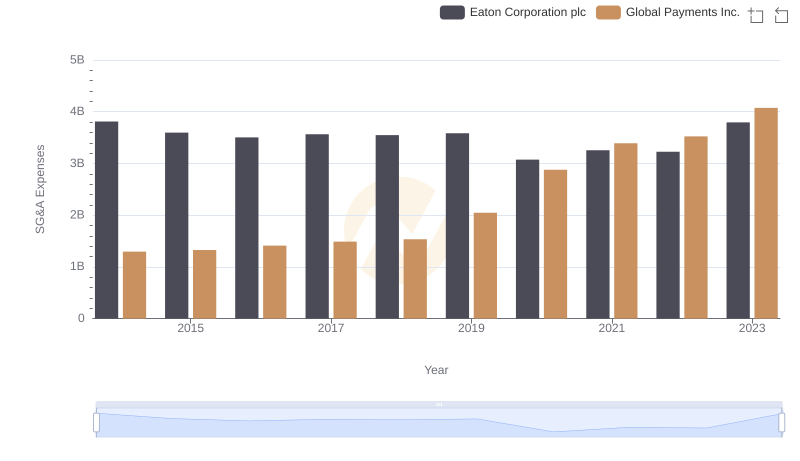
Cost Management Insights: SG&A Expenses for Eaton Corporation plc and Global Payments Inc.