| __timestamp | CSX Corporation | Jacobs Engineering Group Inc. |
|---|---|---|
| Wednesday, January 1, 2014 | 12669000000 | 12695157000 |
| Thursday, January 1, 2015 | 11811000000 | 12114832000 |
| Friday, January 1, 2016 | 11069000000 | 10964157000 |
| Sunday, January 1, 2017 | 11408000000 | 10022788000 |
| Monday, January 1, 2018 | 12250000000 | 14984646000 |
| Tuesday, January 1, 2019 | 11937000000 | 12737868000 |
| Wednesday, January 1, 2020 | 10583000000 | 13566975000 |
| Friday, January 1, 2021 | 12522000000 | 14092632000 |
| Saturday, January 1, 2022 | 14853000000 | 14922825000 |
| Sunday, January 1, 2023 | 14657000000 | 16352414000 |
| Monday, January 1, 2024 | 11500941000 |
Unleashing the power of data
In the ever-evolving landscape of American industry, CSX Corporation and Jacobs Engineering Group Inc. stand as titans in their respective fields. Over the past decade, these companies have showcased intriguing revenue trends that reflect broader economic shifts. From 2014 to 2023, CSX Corporation's revenue experienced a modest growth of approximately 16%, peaking in 2022. Meanwhile, Jacobs Engineering Group Inc. saw a more dynamic increase of around 29% during the same period, with a notable surge in 2023.
The data reveals a fascinating narrative: while CSX Corporation's revenue remained relatively stable, Jacobs Engineering Group Inc. demonstrated resilience and adaptability, particularly in the face of global challenges. However, the absence of data for CSX in 2024 leaves room for speculation about future trajectories. As these companies continue to navigate the complexities of the modern economy, their revenue trends offer valuable insights into their strategic directions.
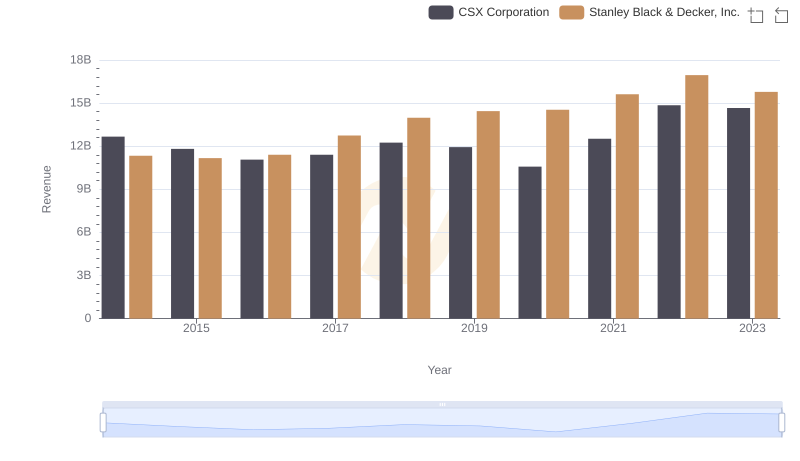
Revenue Insights: CSX Corporation and Stanley Black & Decker, Inc. Performance Compared
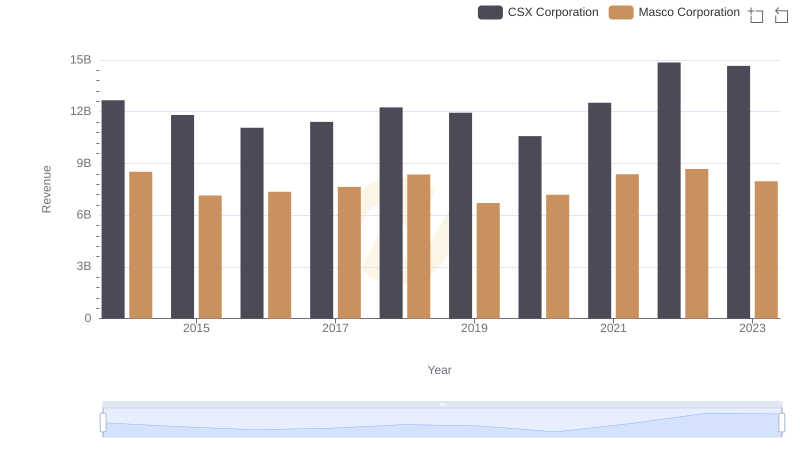
Breaking Down Revenue Trends: CSX Corporation vs Masco Corporation
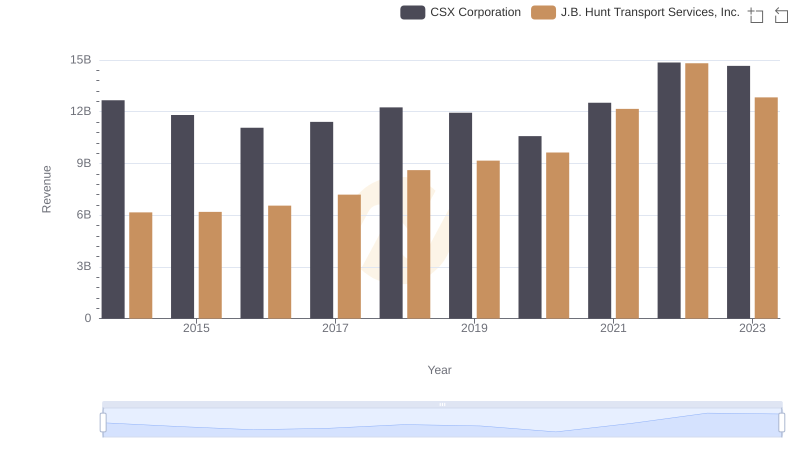
CSX Corporation or J.B. Hunt Transport Services, Inc.: Who Leads in Yearly Revenue?
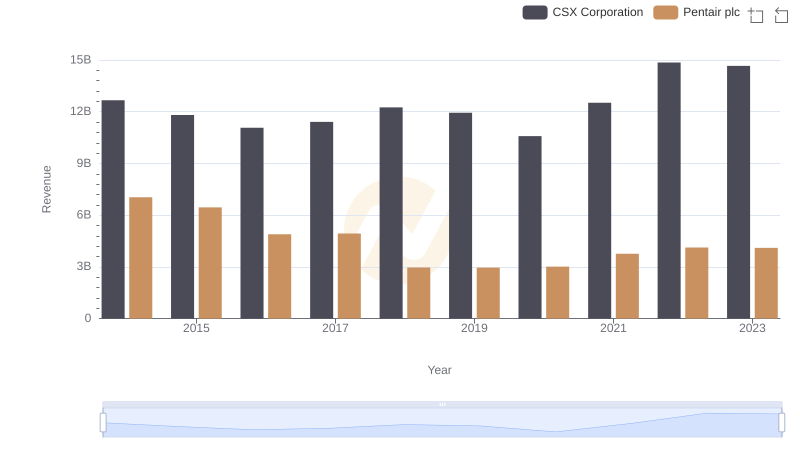
Annual Revenue Comparison: CSX Corporation vs Pentair plc
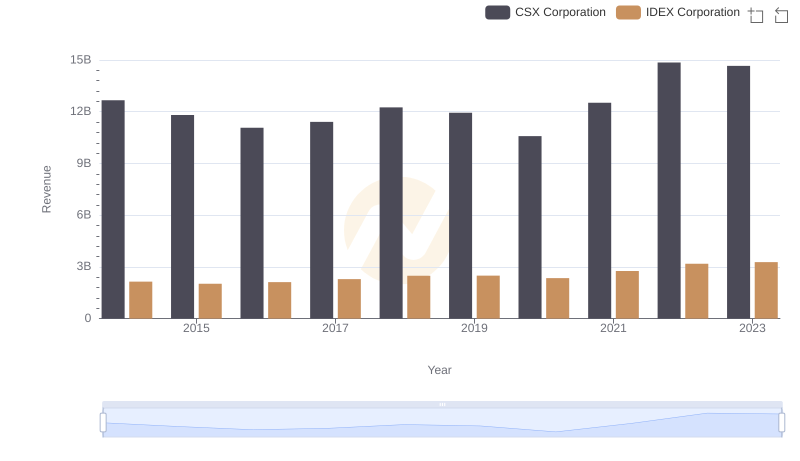
Breaking Down Revenue Trends: CSX Corporation vs IDEX Corporation
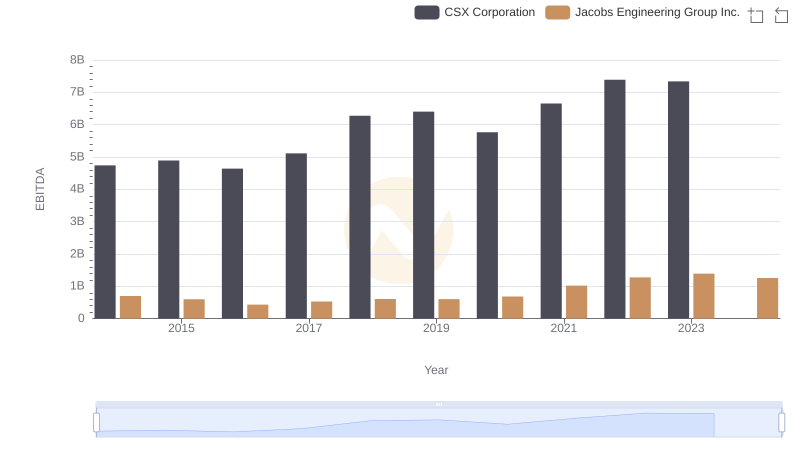
Comprehensive EBITDA Comparison: CSX Corporation vs Jacobs Engineering Group Inc.