| __timestamp | CSX Corporation | IDEX Corporation |
|---|---|---|
| Wednesday, January 1, 2014 | 12669000000 | 2147767000 |
| Thursday, January 1, 2015 | 11811000000 | 2020668000 |
| Friday, January 1, 2016 | 11069000000 | 2113043000 |
| Sunday, January 1, 2017 | 11408000000 | 2287312000 |
| Monday, January 1, 2018 | 12250000000 | 2483666000 |
| Tuesday, January 1, 2019 | 11937000000 | 2494573000 |
| Wednesday, January 1, 2020 | 10583000000 | 2351646000 |
| Friday, January 1, 2021 | 12522000000 | 2764800000 |
| Saturday, January 1, 2022 | 14853000000 | 3181900000 |
| Sunday, January 1, 2023 | 14657000000 | 3273900000 |
| Monday, January 1, 2024 | 3268800000 |
Unlocking the unknown
In the ever-evolving landscape of American industry, CSX Corporation and IDEX Corporation stand as titans in their respective fields. Over the past decade, from 2014 to 2023, these companies have showcased distinct revenue trajectories. CSX Corporation, a leader in rail transportation, experienced a revenue growth of approximately 16% from 2014 to 2023, peaking in 2022 with a 48% increase from its lowest point in 2020. Meanwhile, IDEX Corporation, a diversified industrial manufacturer, saw its revenue rise by about 52% over the same period, with a notable surge in 2023, marking a 62% increase from 2014. This data highlights the resilience and adaptability of these corporations amidst economic fluctuations. As we delve deeper into these trends, it becomes evident that strategic innovation and market adaptation are key drivers of their sustained growth.
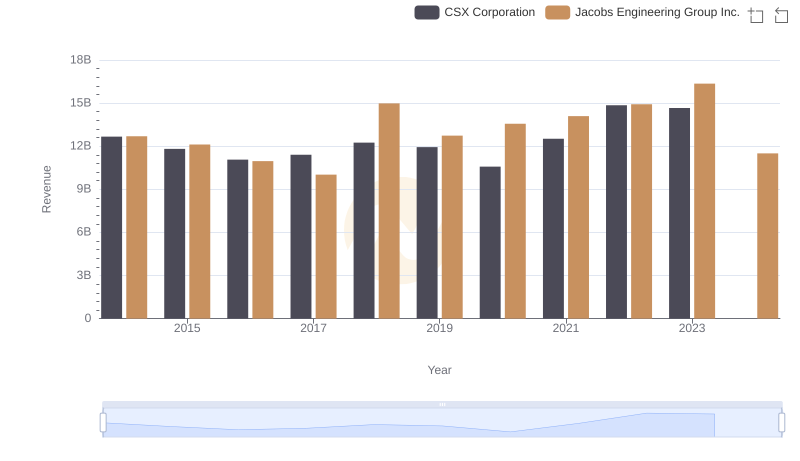
Breaking Down Revenue Trends: CSX Corporation vs Jacobs Engineering Group Inc.
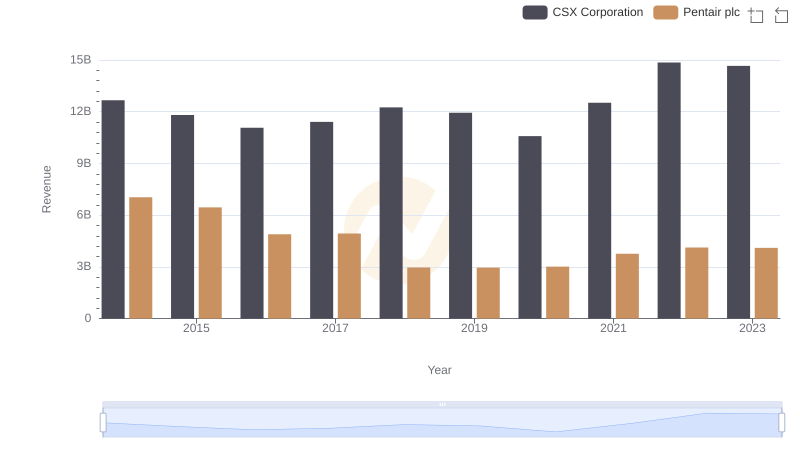
Annual Revenue Comparison: CSX Corporation vs Pentair plc
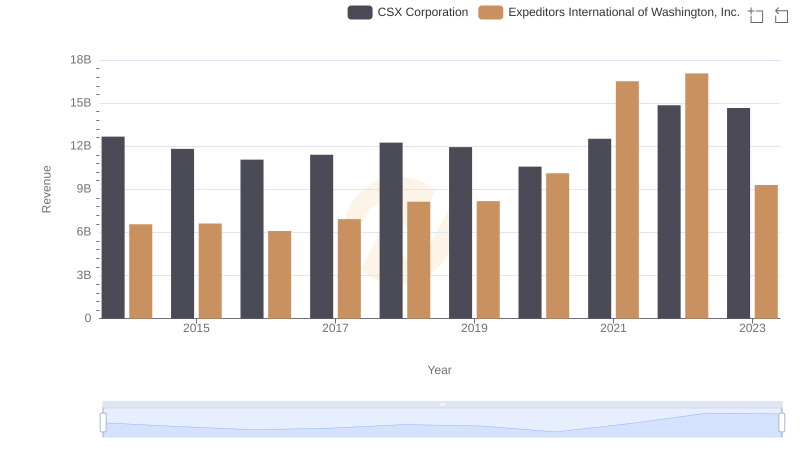
Annual Revenue Comparison: CSX Corporation vs Expeditors International of Washington, Inc.
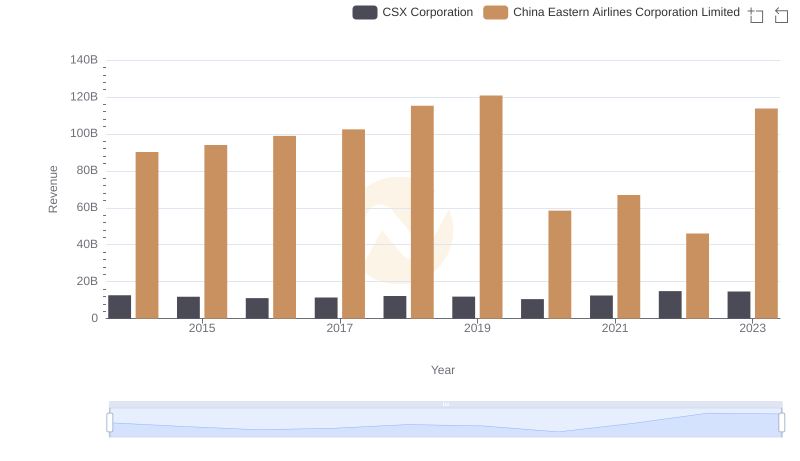
CSX Corporation and China Eastern Airlines Corporation Limited: A Comprehensive Revenue Analysis

Breaking Down Revenue Trends: CSX Corporation vs Avery Dennison Corporation
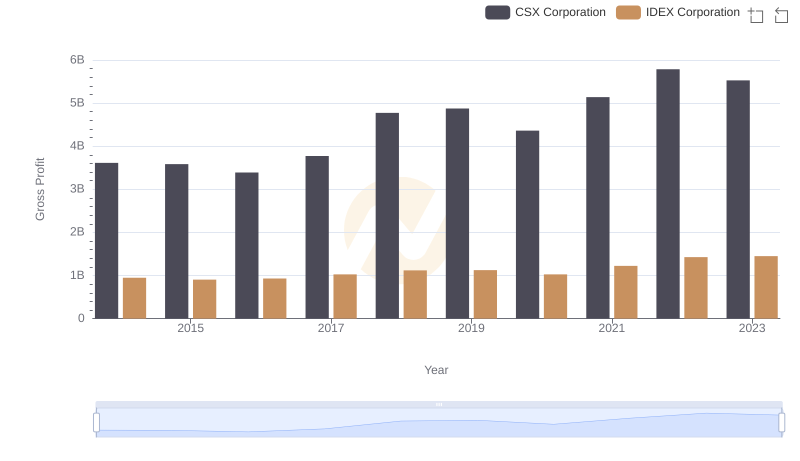
Gross Profit Analysis: Comparing CSX Corporation and IDEX Corporation