| __timestamp | CSX Corporation | J.B. Hunt Transport Services, Inc. |
|---|---|---|
| Wednesday, January 1, 2014 | 12669000000 | 6165441000 |
| Thursday, January 1, 2015 | 11811000000 | 6187646000 |
| Friday, January 1, 2016 | 11069000000 | 6555459000 |
| Sunday, January 1, 2017 | 11408000000 | 7189568000 |
| Monday, January 1, 2018 | 12250000000 | 8614874000 |
| Tuesday, January 1, 2019 | 11937000000 | 9165258000 |
| Wednesday, January 1, 2020 | 10583000000 | 9636573000 |
| Friday, January 1, 2021 | 12522000000 | 12168302000 |
| Saturday, January 1, 2022 | 14853000000 | 14813999000 |
| Sunday, January 1, 2023 | 14657000000 | 12829665000 |
In pursuit of knowledge
In the competitive world of transportation, CSX Corporation and J.B. Hunt Transport Services, Inc. have been vying for the top spot in annual revenue. Over the past decade, CSX has consistently outperformed J.B. Hunt, with an average revenue of approximately $12.4 billion, compared to J.B. Hunt's $9.3 billion. However, the gap has been narrowing.
From 2014 to 2023, CSX's revenue peaked in 2022 at $14.9 billion, while J.B. Hunt reached its highest in the same year with $14.8 billion, marking a significant 140% increase from its 2014 revenue. Notably, in 2021, J.B. Hunt's revenue surged past $12 billion, closing in on CSX's $12.5 billion. This trend suggests a dynamic shift in the industry, with J.B. Hunt rapidly gaining ground. As we look to the future, the question remains: will J.B. Hunt overtake CSX in the coming years?
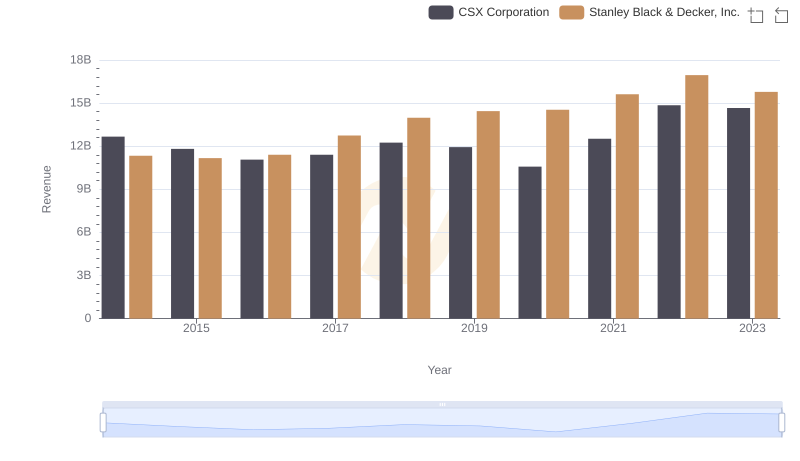
Revenue Insights: CSX Corporation and Stanley Black & Decker, Inc. Performance Compared
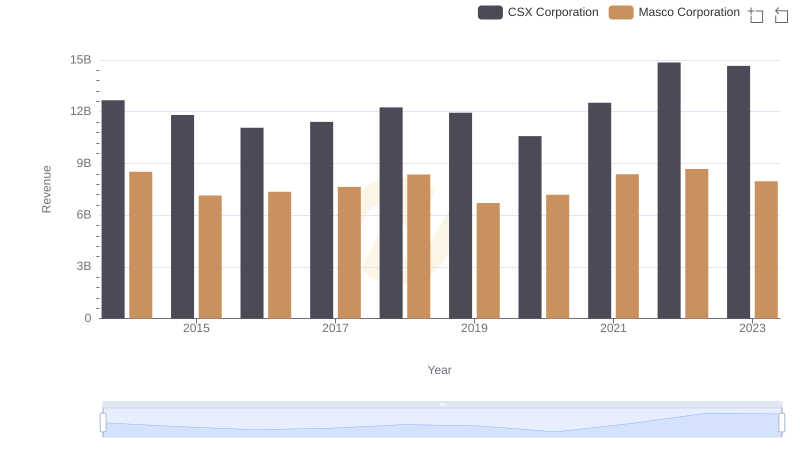
Breaking Down Revenue Trends: CSX Corporation vs Masco Corporation
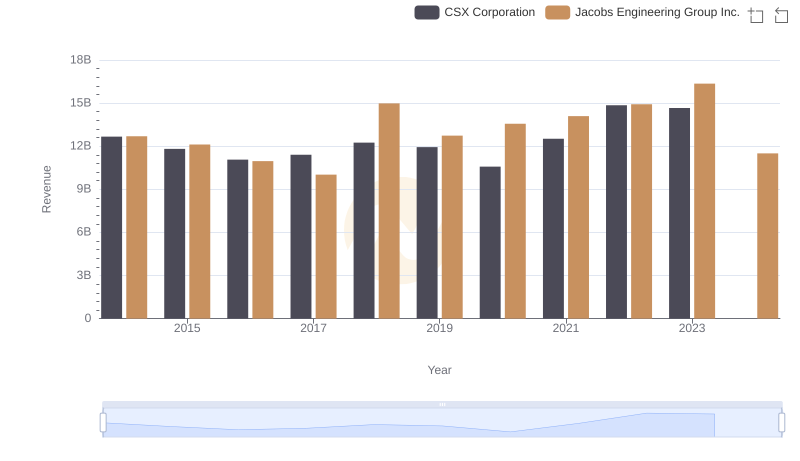
Breaking Down Revenue Trends: CSX Corporation vs Jacobs Engineering Group Inc.
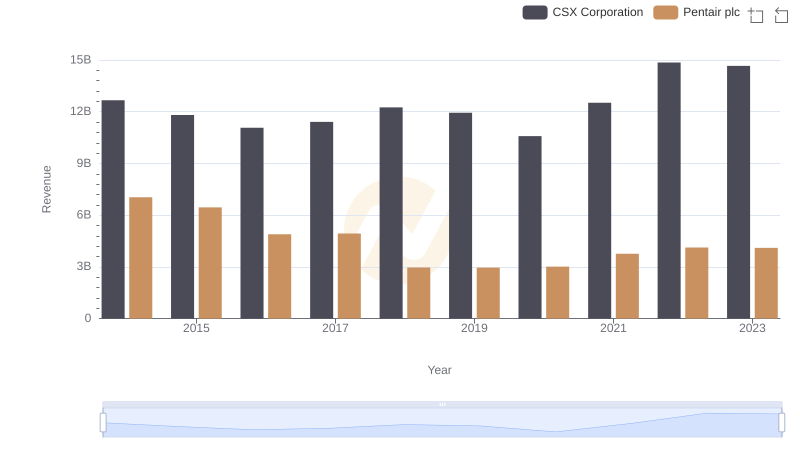
Annual Revenue Comparison: CSX Corporation vs Pentair plc
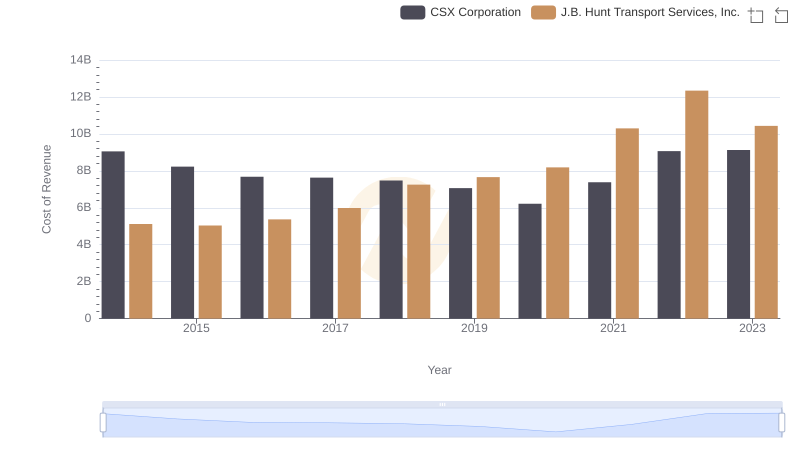
Analyzing Cost of Revenue: CSX Corporation and J.B. Hunt Transport Services, Inc.
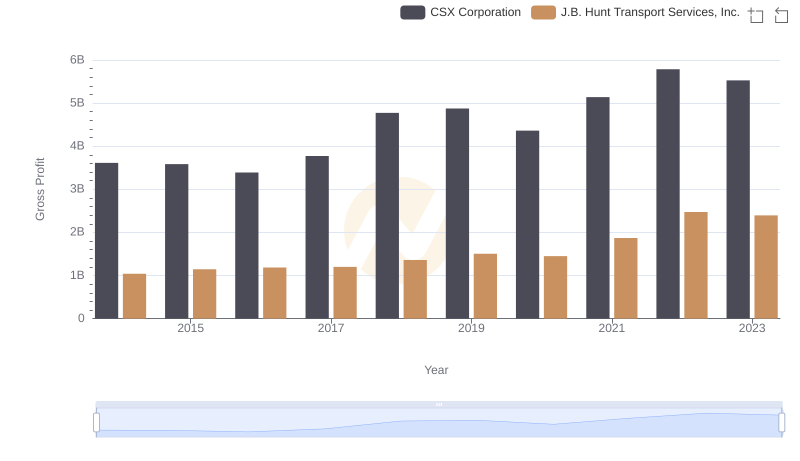
Who Generates Higher Gross Profit? CSX Corporation or J.B. Hunt Transport Services, Inc.
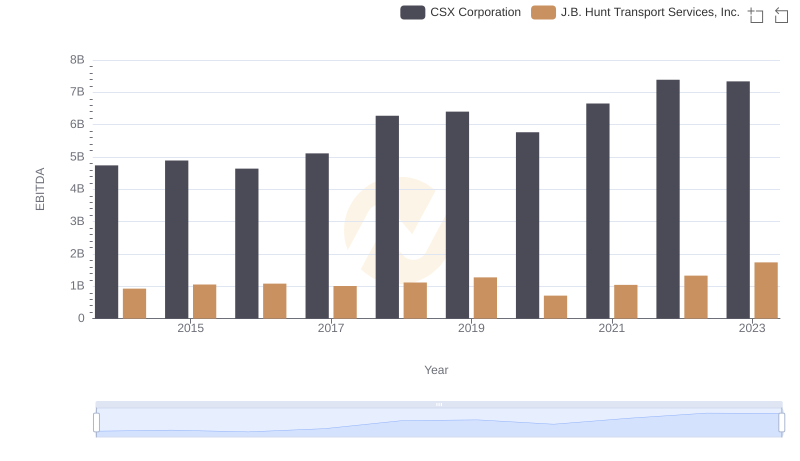
Professional EBITDA Benchmarking: CSX Corporation vs J.B. Hunt Transport Services, Inc.