| __timestamp | CSX Corporation | Jacobs Engineering Group Inc. |
|---|---|---|
| Wednesday, January 1, 2014 | 4740000000 | 699015000 |
| Thursday, January 1, 2015 | 4890000000 | 598932000 |
| Friday, January 1, 2016 | 4640000000 | 431954000 |
| Sunday, January 1, 2017 | 5113000000 | 527765000 |
| Monday, January 1, 2018 | 6274000000 | 606328000 |
| Tuesday, January 1, 2019 | 6402000000 | 604075000 |
| Wednesday, January 1, 2020 | 5764000000 | 685042000 |
| Friday, January 1, 2021 | 6653000000 | 1019116000 |
| Saturday, January 1, 2022 | 7390000000 | 1277649000 |
| Sunday, January 1, 2023 | 7340000000 | 1392039000 |
| Monday, January 1, 2024 | 1255083000 |
Igniting the spark of knowledge
In the ever-evolving landscape of American industry, CSX Corporation and Jacobs Engineering Group Inc. have emerged as key players, each carving out a distinct niche. Over the past decade, CSX Corporation has consistently demonstrated robust financial health, with its EBITDA growing by approximately 55% from 2014 to 2023. This growth underscores its strategic prowess in the transportation sector. Meanwhile, Jacobs Engineering Group Inc. has shown a remarkable 99% increase in EBITDA over the same period, reflecting its dynamic expansion in engineering and construction services.
While CSX's EBITDA peaked in 2022, Jacobs Engineering continued its upward trajectory into 2023, despite a slight dip projected for 2024. This comparison not only highlights the resilience and adaptability of these corporations but also offers a glimpse into the broader economic trends shaping their respective industries.
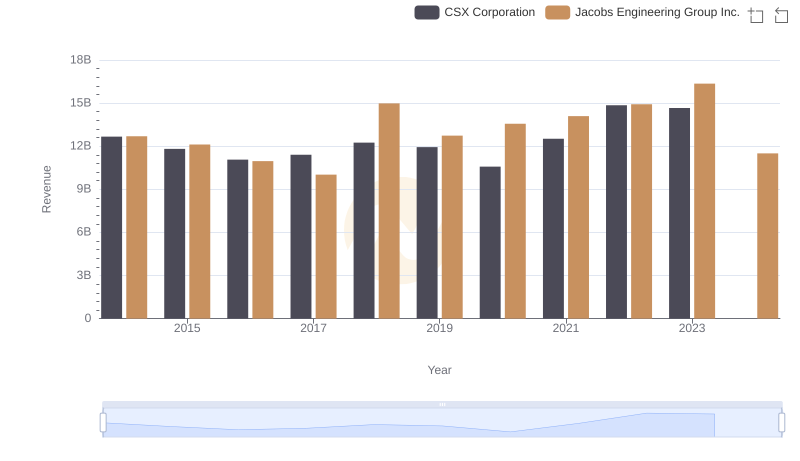
Breaking Down Revenue Trends: CSX Corporation vs Jacobs Engineering Group Inc.
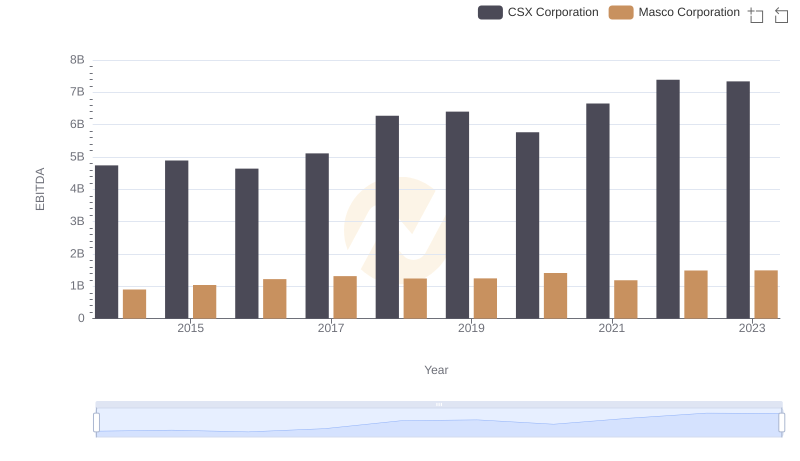
A Professional Review of EBITDA: CSX Corporation Compared to Masco Corporation
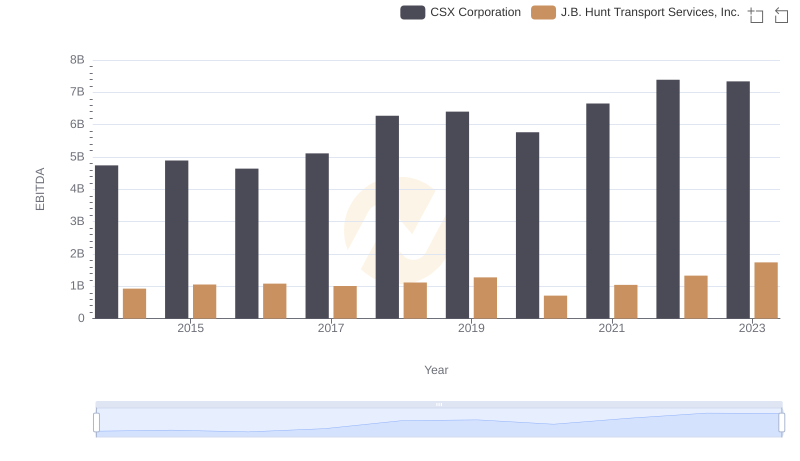
Professional EBITDA Benchmarking: CSX Corporation vs J.B. Hunt Transport Services, Inc.
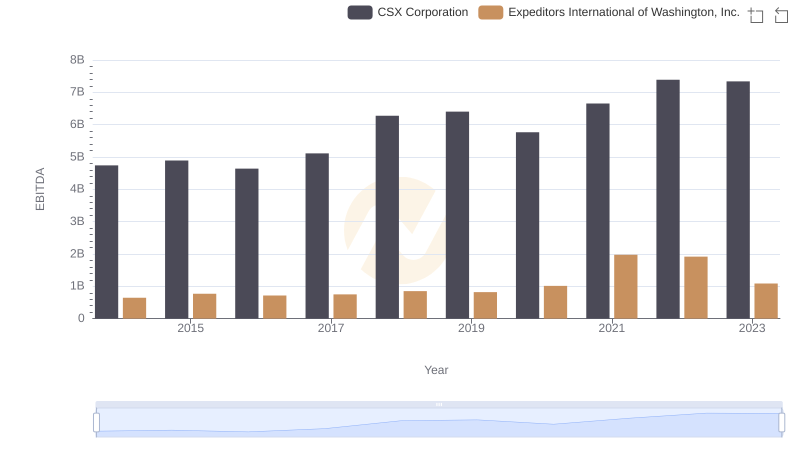
CSX Corporation and Expeditors International of Washington, Inc.: A Detailed Examination of EBITDA Performance