| __timestamp | CSX Corporation | Expeditors International of Washington, Inc. |
|---|---|---|
| Wednesday, January 1, 2014 | 12669000000 | 6564721000 |
| Thursday, January 1, 2015 | 11811000000 | 6616632000 |
| Friday, January 1, 2016 | 11069000000 | 6098037000 |
| Sunday, January 1, 2017 | 11408000000 | 6920948000 |
| Monday, January 1, 2018 | 12250000000 | 8138365000 |
| Tuesday, January 1, 2019 | 11937000000 | 8175426000 |
| Wednesday, January 1, 2020 | 10583000000 | 10116481000 |
| Friday, January 1, 2021 | 12522000000 | 16523517000 |
| Saturday, January 1, 2022 | 14853000000 | 17071284000 |
| Sunday, January 1, 2023 | 14657000000 | 9300110000 |
| Monday, January 1, 2024 | 10600515000 |
Unlocking the unknown
In the ever-evolving landscape of American business, the transportation and logistics sectors have witnessed significant shifts over the past decade. CSX Corporation, a leading player in the rail transportation industry, and Expeditors International of Washington, Inc., a global logistics powerhouse, have both navigated through economic fluctuations with varying degrees of success.
From 2014 to 2023, CSX Corporation's revenue showcased a steady growth trajectory, peaking in 2022 with a remarkable 48% increase from its 2016 low. Meanwhile, Expeditors International experienced a dramatic surge, particularly between 2020 and 2022, where its revenue nearly doubled, reflecting the global demand for efficient logistics solutions during the pandemic.
As we look towards the future, these trends highlight the resilience and adaptability of these industry giants, offering valuable insights into the broader economic landscape.
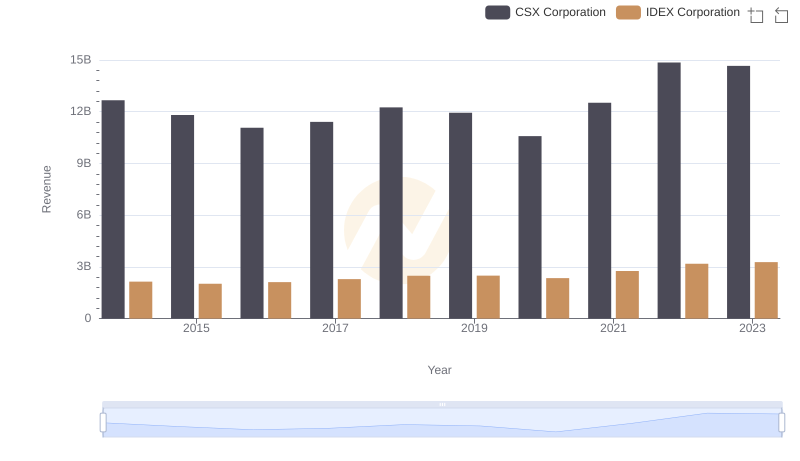
Breaking Down Revenue Trends: CSX Corporation vs IDEX Corporation
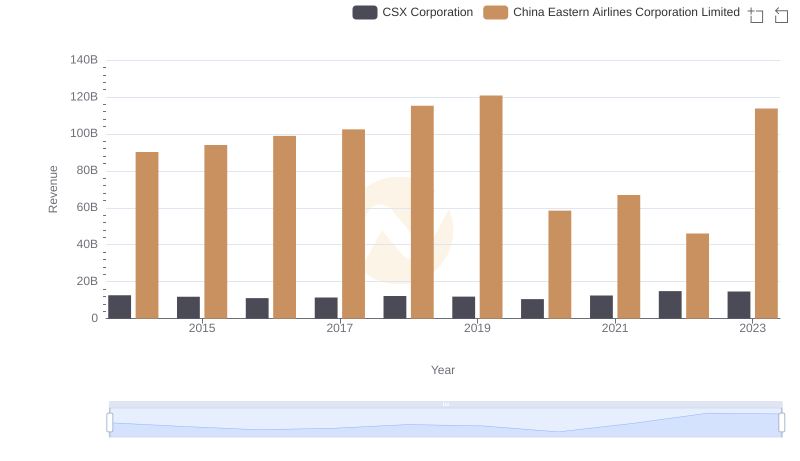
CSX Corporation and China Eastern Airlines Corporation Limited: A Comprehensive Revenue Analysis

Breaking Down Revenue Trends: CSX Corporation vs Avery Dennison Corporation
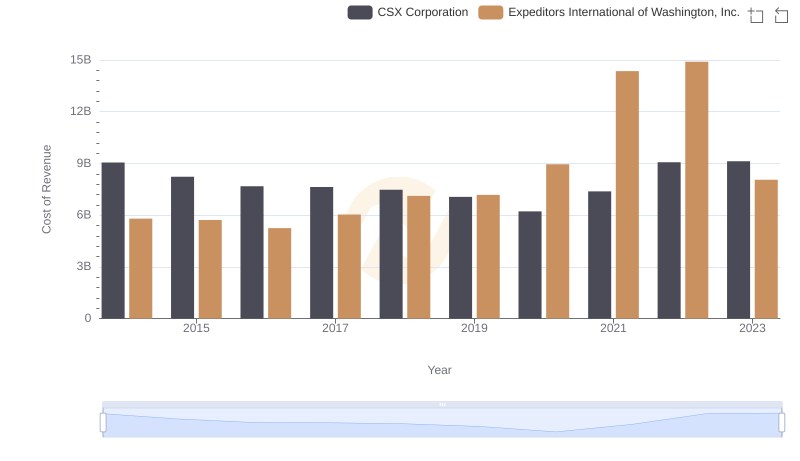
Cost of Revenue: Key Insights for CSX Corporation and Expeditors International of Washington, Inc.
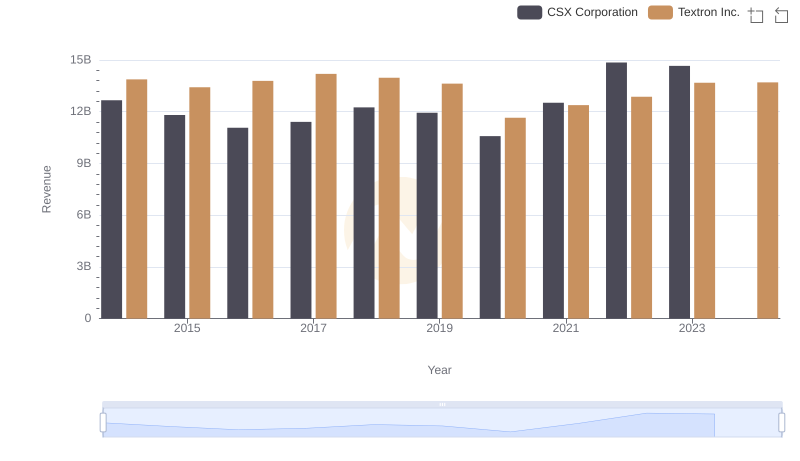
Who Generates More Revenue? CSX Corporation or Textron Inc.
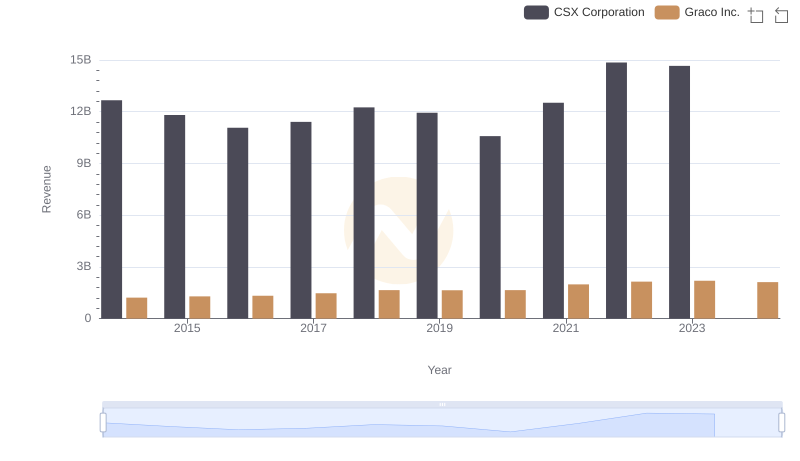
Who Generates More Revenue? CSX Corporation or Graco Inc.
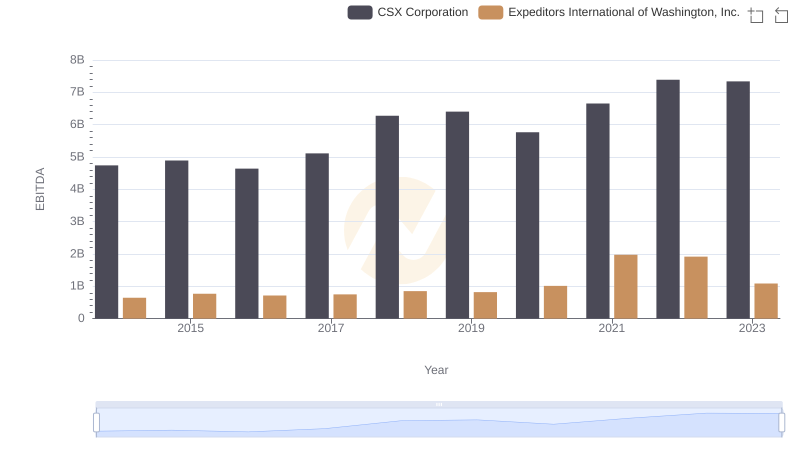
CSX Corporation and Expeditors International of Washington, Inc.: A Detailed Examination of EBITDA Performance