| __timestamp | CSX Corporation | IDEX Corporation |
|---|---|---|
| Wednesday, January 1, 2014 | 3613000000 | 949315000 |
| Thursday, January 1, 2015 | 3584000000 | 904315000 |
| Friday, January 1, 2016 | 3389000000 | 930767000 |
| Sunday, January 1, 2017 | 3773000000 | 1026678000 |
| Monday, January 1, 2018 | 4773000000 | 1117895000 |
| Tuesday, January 1, 2019 | 4874000000 | 1125034000 |
| Wednesday, January 1, 2020 | 4362000000 | 1027424000 |
| Friday, January 1, 2021 | 5140000000 | 1224500000 |
| Saturday, January 1, 2022 | 5785000000 | 1426900000 |
| Sunday, January 1, 2023 | 5527000000 | 1448500000 |
| Monday, January 1, 2024 | 1454800000 |
Data in motion
In the ever-evolving landscape of American industry, understanding the financial health of key players is crucial. Over the past decade, CSX Corporation and IDEX Corporation have demonstrated distinct trajectories in their gross profit margins. From 2014 to 2023, CSX Corporation's gross profit surged by approximately 53%, peaking in 2022. This growth reflects the company's strategic initiatives and resilience in the face of economic challenges. In contrast, IDEX Corporation, while smaller in scale, exhibited a steady increase of about 52% in the same period, showcasing its robust business model and adaptability.
The data reveals that CSX consistently outperformed IDEX, with gross profits averaging four times higher. However, IDEX's consistent growth underscores its potential in niche markets. As we look to the future, these trends offer valuable insights into the competitive dynamics of the industrial sector.
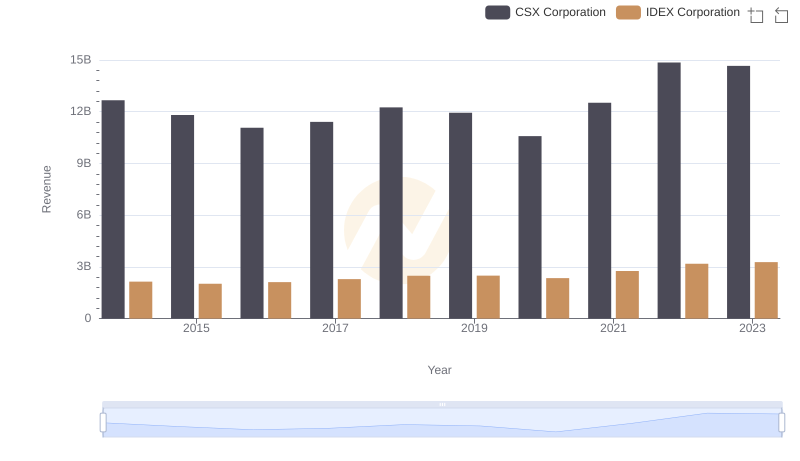
Breaking Down Revenue Trends: CSX Corporation vs IDEX Corporation
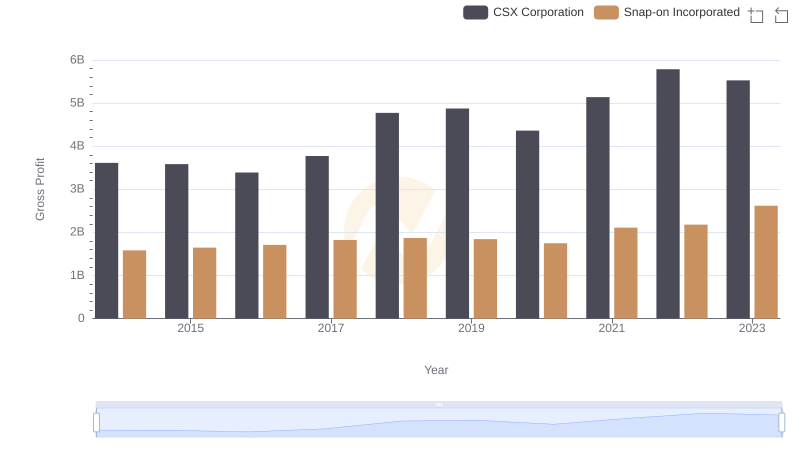
Gross Profit Comparison: CSX Corporation and Snap-on Incorporated Trends
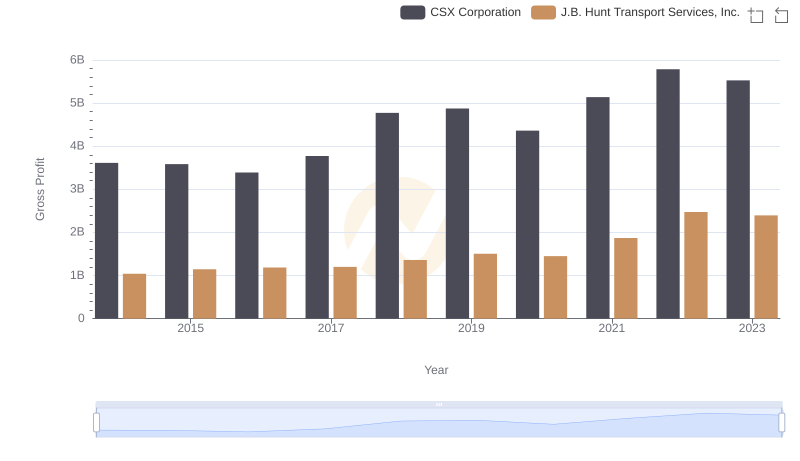
Who Generates Higher Gross Profit? CSX Corporation or J.B. Hunt Transport Services, Inc.
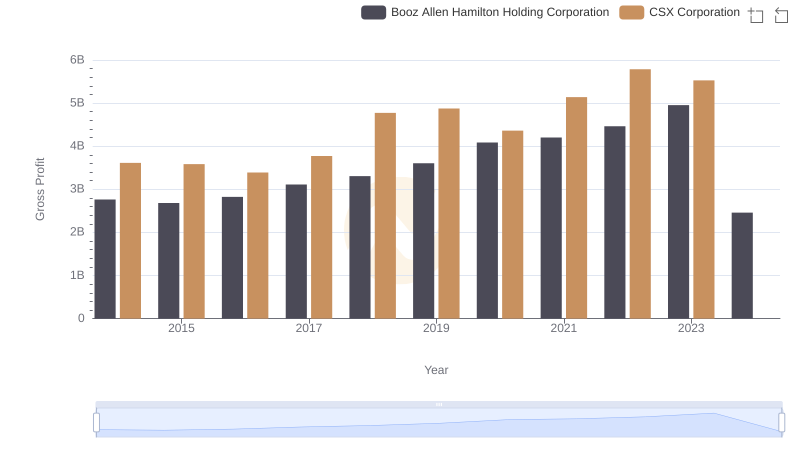
Gross Profit Comparison: CSX Corporation and Booz Allen Hamilton Holding Corporation Trends
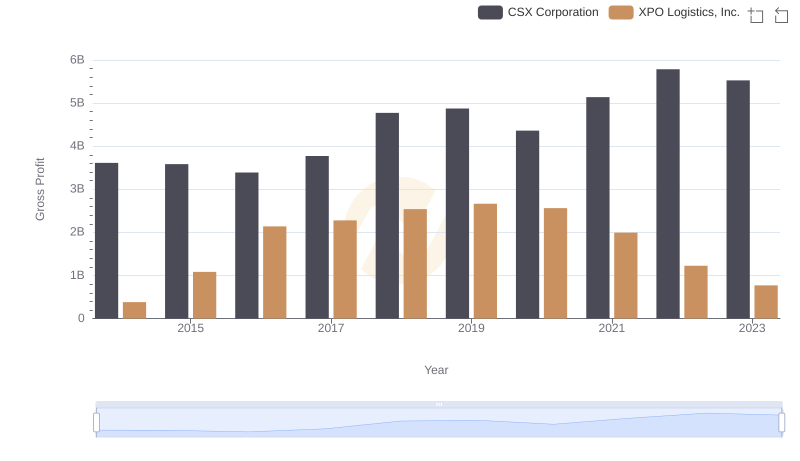
Gross Profit Trends Compared: CSX Corporation vs XPO Logistics, Inc.