| __timestamp | 3M Company | HEICO Corporation |
|---|---|---|
| Wednesday, January 1, 2014 | 31821000000 | 1132311000 |
| Thursday, January 1, 2015 | 30274000000 | 1188648000 |
| Friday, January 1, 2016 | 30109000000 | 1376258000 |
| Sunday, January 1, 2017 | 31657000000 | 1524813000 |
| Monday, January 1, 2018 | 32765000000 | 1777721000 |
| Tuesday, January 1, 2019 | 32136000000 | 2055647000 |
| Wednesday, January 1, 2020 | 32184000000 | 1787009000 |
| Friday, January 1, 2021 | 35355000000 | 1865682000 |
| Saturday, January 1, 2022 | 34229000000 | 2208322000 |
| Sunday, January 1, 2023 | 32681000000 | 2968105000 |
| Monday, January 1, 2024 | 24575000000 | 3857669000 |
Unleashing insights
In the ever-evolving landscape of American industry, 3M Company and HEICO Corporation stand as titans in their respective fields. From 2014 to 2024, these companies have showcased contrasting revenue trajectories. 3M, a stalwart in manufacturing, saw its revenue peak in 2021, with a 12% increase from 2016, before experiencing a decline by 2024. Meanwhile, HEICO, a leader in aerospace and electronics, demonstrated a remarkable growth story, with its revenue more than tripling over the same period.
This data highlights the resilience and adaptability of HEICO, which managed to grow even during challenging economic times. In contrast, 3M's revenue fluctuations reflect broader market challenges. As we look to the future, these trends offer valuable insights into the strategic directions and market dynamics influencing these industry giants.
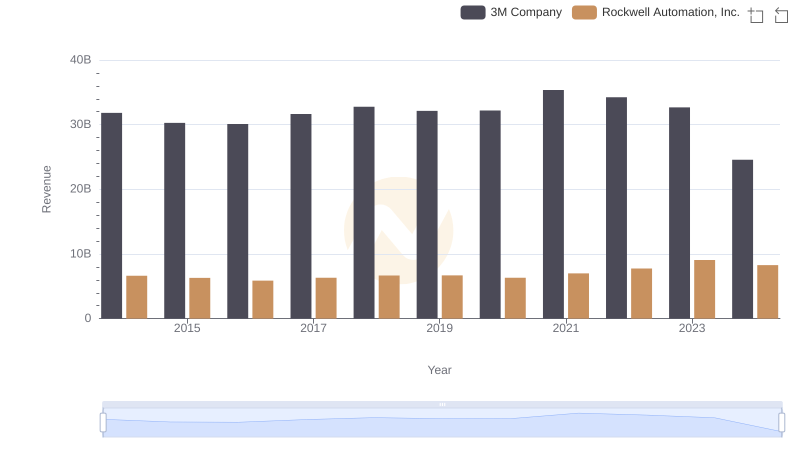
3M Company vs Rockwell Automation, Inc.: Examining Key Revenue Metrics
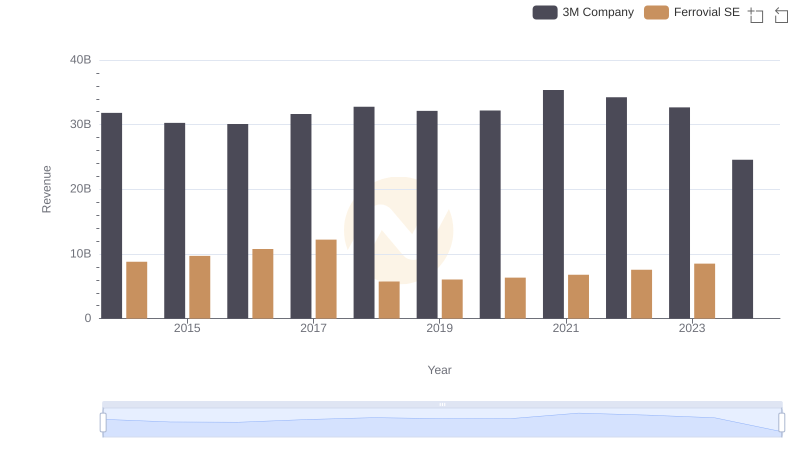
Comparing Revenue Performance: 3M Company or Ferrovial SE?
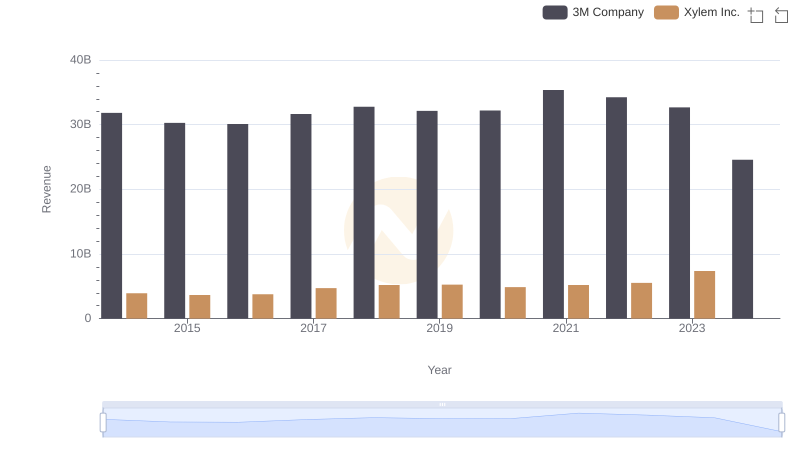
Annual Revenue Comparison: 3M Company vs Xylem Inc.
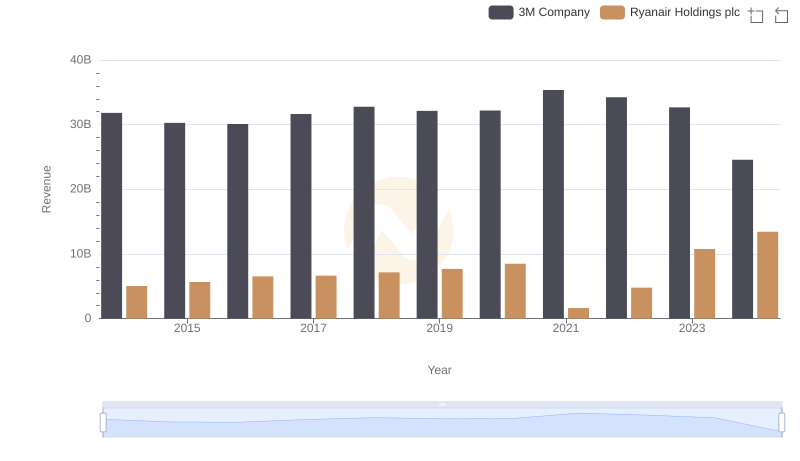
Breaking Down Revenue Trends: 3M Company vs Ryanair Holdings plc
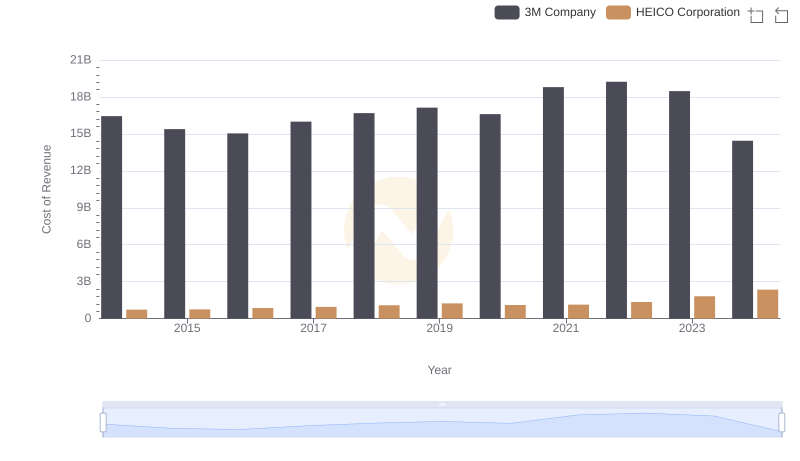
Comparing Cost of Revenue Efficiency: 3M Company vs HEICO Corporation
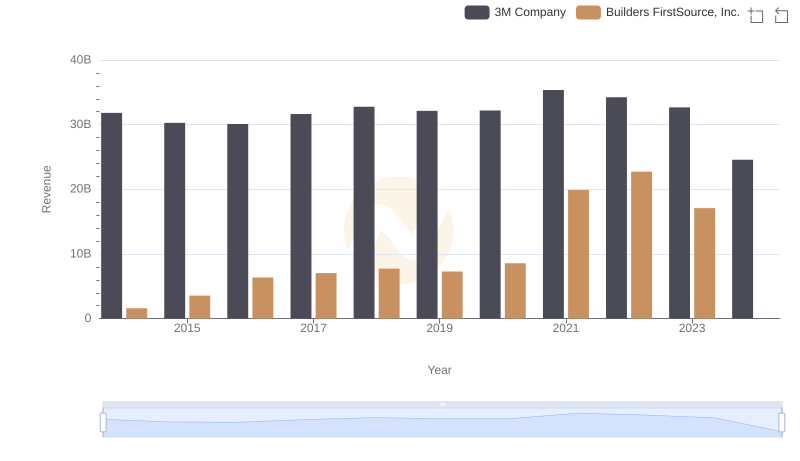
Breaking Down Revenue Trends: 3M Company vs Builders FirstSource, Inc.
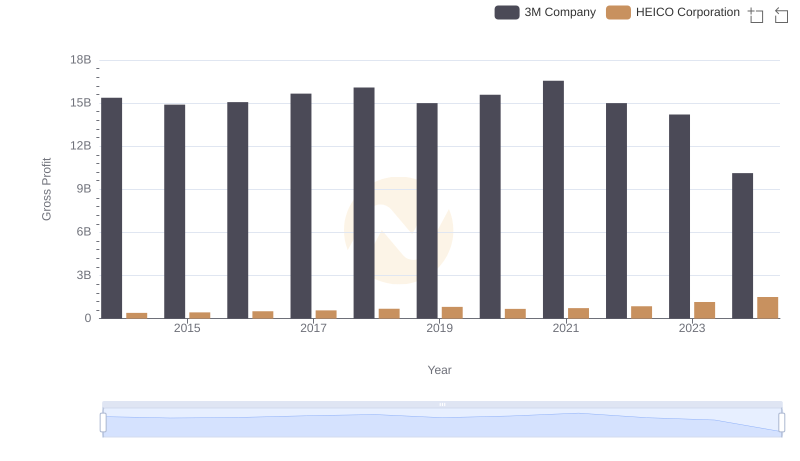
Key Insights on Gross Profit: 3M Company vs HEICO Corporation