| __timestamp | Cintas Corporation | TransDigm Group Incorporated |
|---|---|---|
| Wednesday, January 1, 2014 | 2637426000 | 1105032000 |
| Thursday, January 1, 2015 | 2555549000 | 1257270000 |
| Friday, January 1, 2016 | 2775588000 | 1443348000 |
| Sunday, January 1, 2017 | 2943086000 | 1519659000 |
| Monday, January 1, 2018 | 3568109000 | 1633616000 |
| Tuesday, January 1, 2019 | 3763715000 | 2413932000 |
| Wednesday, January 1, 2020 | 3851372000 | 2456000000 |
| Friday, January 1, 2021 | 3801689000 | 2285000000 |
| Saturday, January 1, 2022 | 4222213000 | 2330000000 |
| Sunday, January 1, 2023 | 4642401000 | 2743000000 |
| Monday, January 1, 2024 | 4910199000 | 3268000000 |
Unlocking the unknown
In the competitive landscape of the U.S. stock market, Cintas Corporation and TransDigm Group Incorporated stand out as leaders in their respective industries. Over the past decade, from 2014 to 2024, these companies have shown remarkable growth in their cost of revenue, a key indicator of their operational scale and efficiency.
Cintas Corporation, a leader in corporate identity uniforms, has seen its cost of revenue grow by approximately 86% from 2014 to 2024. This steady increase reflects its expanding market presence and operational efficiency.
TransDigm Group, a major player in aerospace components, has experienced a significant 196% rise in its cost of revenue over the same period. This growth underscores its strategic acquisitions and robust demand in the aerospace sector.
Both companies exemplify resilience and strategic growth, making them fascinating subjects for investors and market analysts alike.
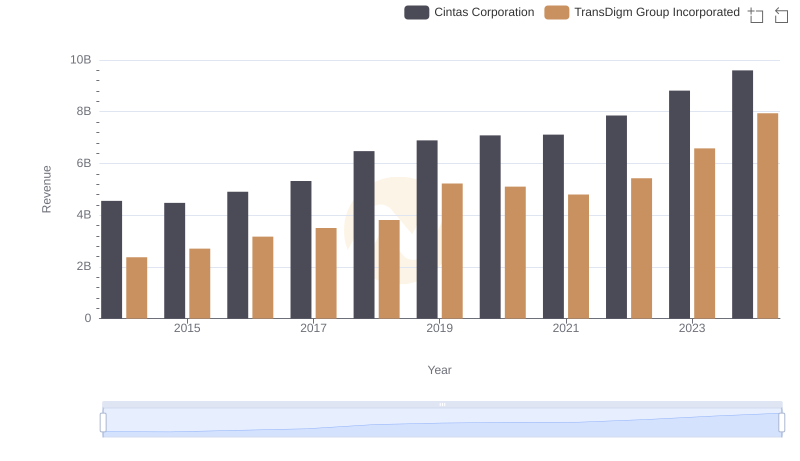
Cintas Corporation or TransDigm Group Incorporated: Who Leads in Yearly Revenue?
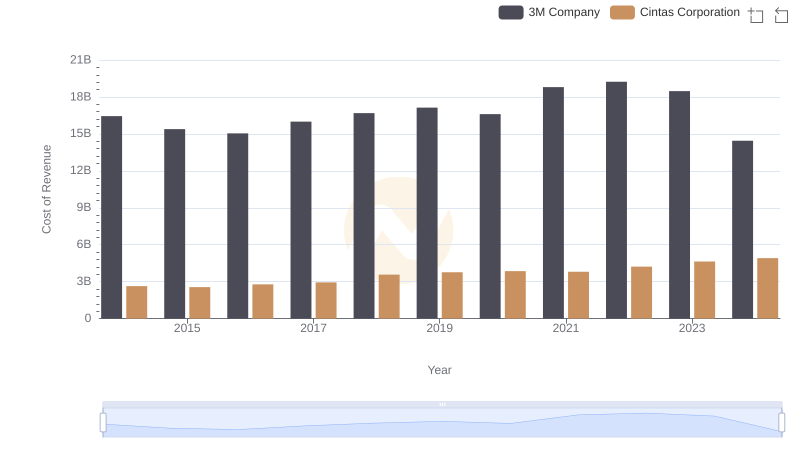
Analyzing Cost of Revenue: Cintas Corporation and 3M Company
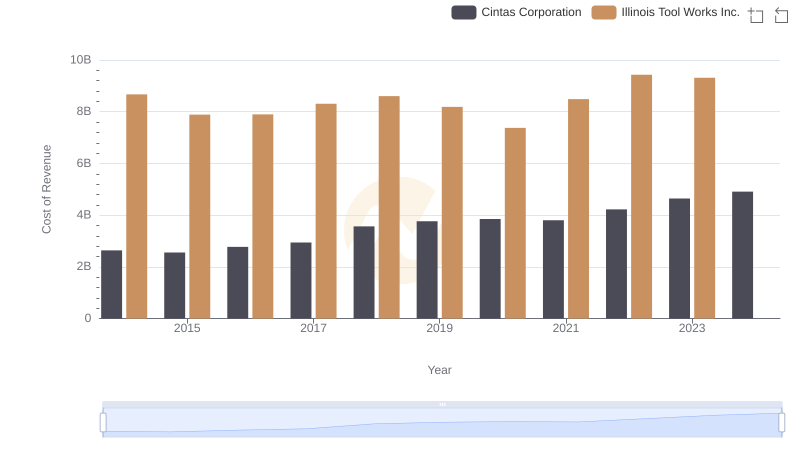
Cost of Revenue Comparison: Cintas Corporation vs Illinois Tool Works Inc.
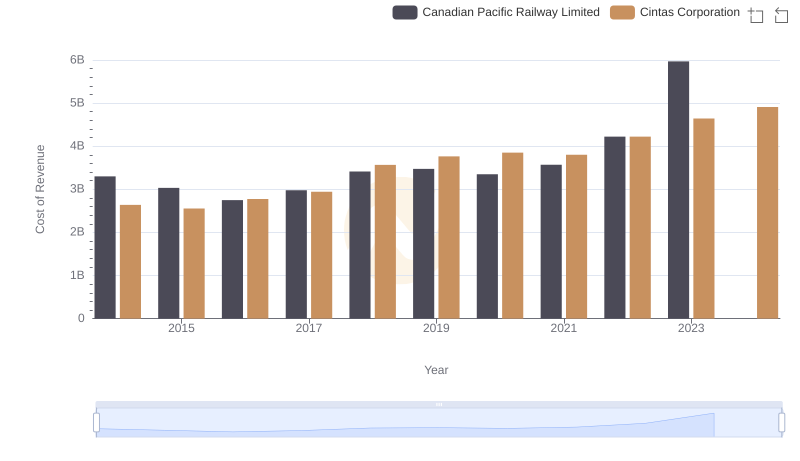
Cintas Corporation vs Canadian Pacific Railway Limited: Efficiency in Cost of Revenue Explored
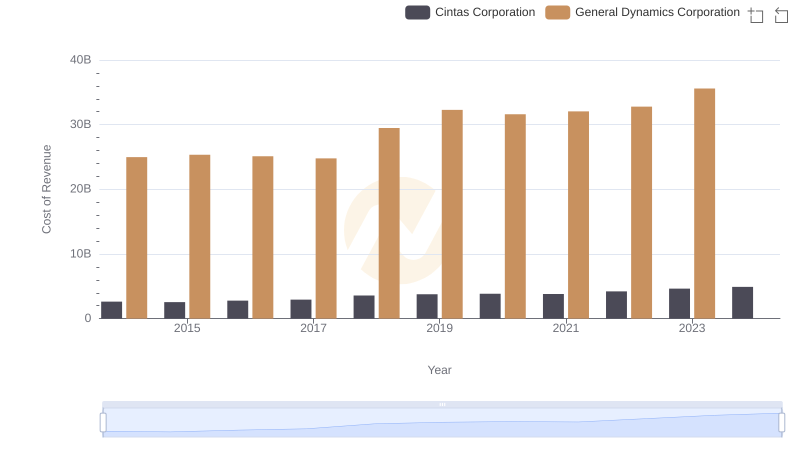
Cintas Corporation vs General Dynamics Corporation: Efficiency in Cost of Revenue Explored
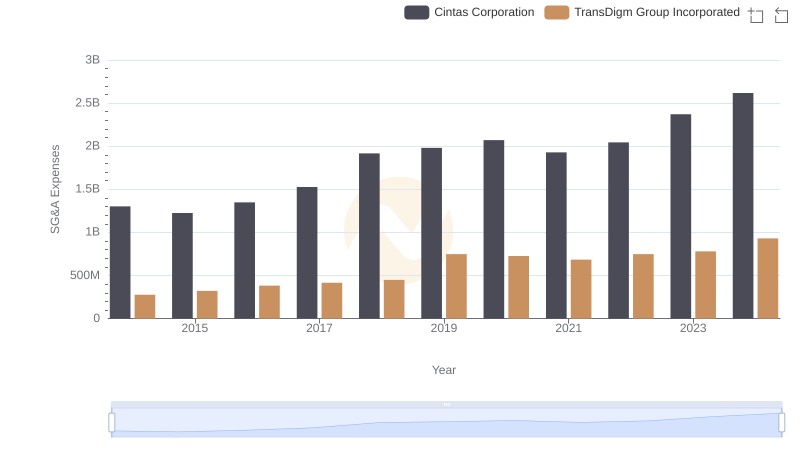
Cintas Corporation or TransDigm Group Incorporated: Who Manages SG&A Costs Better?
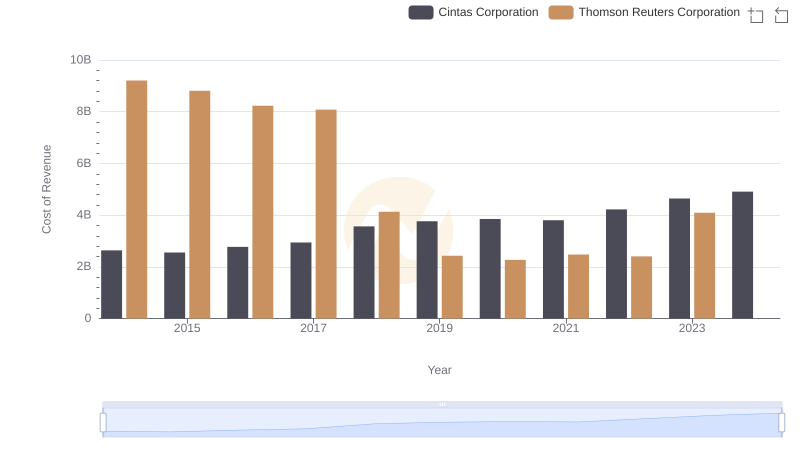
Cost Insights: Breaking Down Cintas Corporation and Thomson Reuters Corporation's Expenses
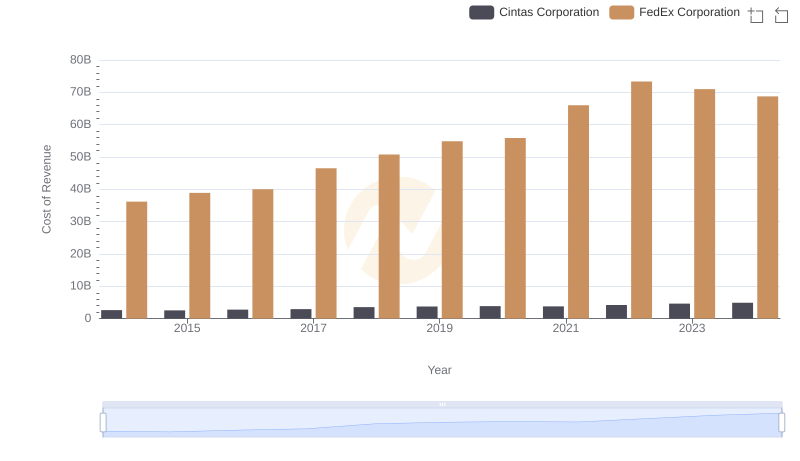
Cintas Corporation vs FedEx Corporation: Efficiency in Cost of Revenue Explored
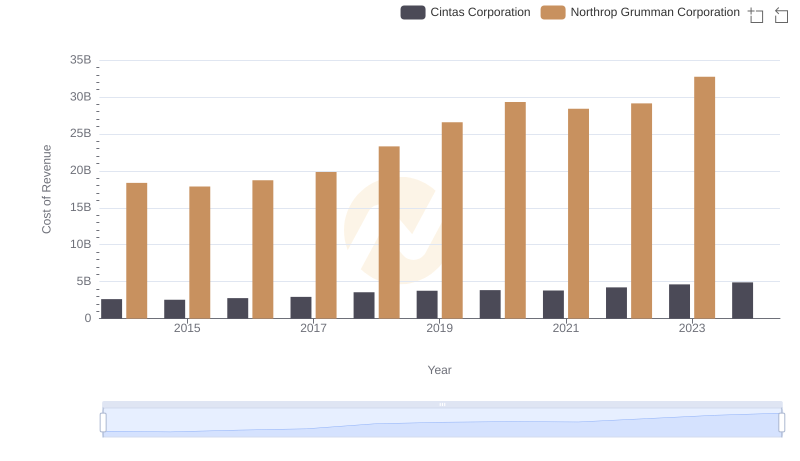
Cost of Revenue: Key Insights for Cintas Corporation and Northrop Grumman Corporation