| __timestamp | Arista Networks, Inc. | Sony Group Corporation |
|---|---|---|
| Wednesday, January 1, 2014 | 192015000 | 5956211000000 |
| Thursday, January 1, 2015 | 294031000 | 6158134000000 |
| Friday, January 1, 2016 | 406051000 | 6074652000000 |
| Sunday, January 1, 2017 | 584417000 | 5663154000000 |
| Monday, January 1, 2018 | 777992000 | 6230422000000 |
| Tuesday, January 1, 2019 | 866368000 | 6263196000000 |
| Wednesday, January 1, 2020 | 835626000 | 5925049000000 |
| Friday, January 1, 2021 | 1067258000 | 6561559000000 |
| Saturday, January 1, 2022 | 1705614000 | 7219841000000 |
| Sunday, January 1, 2023 | 2229887000 | 8398931000000 |
| Monday, January 1, 2024 | 2511843000 | 9695687000000 |
In pursuit of knowledge
In the ever-evolving landscape of global technology and entertainment, understanding the cost of revenue is crucial for assessing a company's financial health. Arista Networks, Inc., a leader in cloud networking solutions, and Sony Group Corporation, a titan in electronics and entertainment, present a fascinating study in contrasts. From 2014 to 2023, Arista Networks saw a staggering increase in its cost of revenue, growing over 1,000%, reflecting its rapid expansion and scaling efforts. In contrast, Sony's cost of revenue, while significantly larger, grew at a more modest pace of approximately 41% over the same period, highlighting its established market presence and diversified portfolio. Notably, data for Arista Networks in 2024 is missing, suggesting a potential gap in reporting or a strategic shift. This analysis underscores the dynamic nature of these industries and the strategic decisions companies must make to thrive.
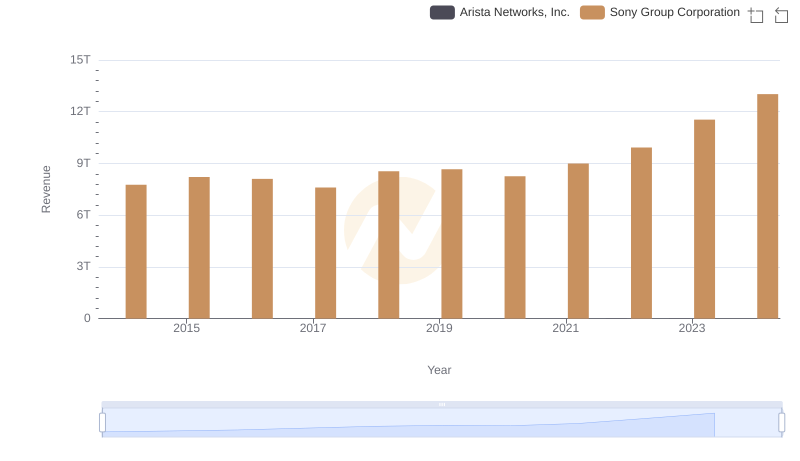
Annual Revenue Comparison: Arista Networks, Inc. vs Sony Group Corporation
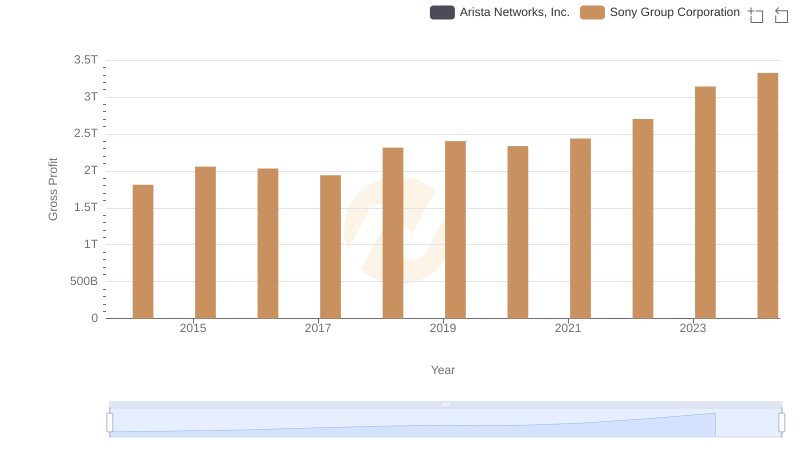
Arista Networks, Inc. vs Sony Group Corporation: A Gross Profit Performance Breakdown
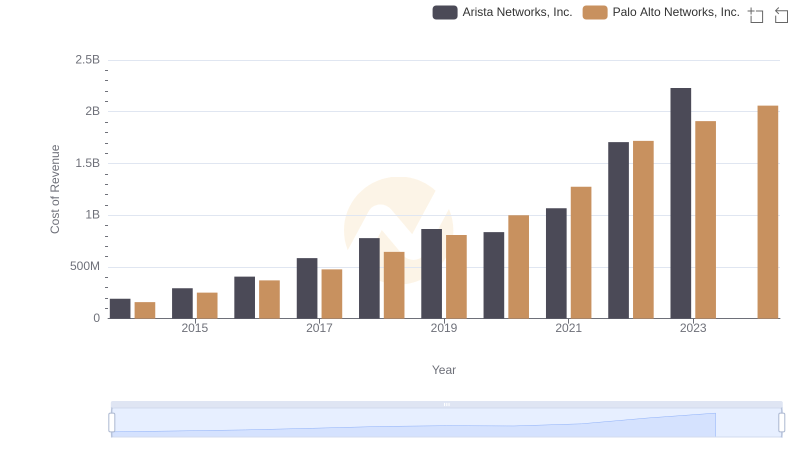
Cost of Revenue: Key Insights for Arista Networks, Inc. and Palo Alto Networks, Inc.

Cost of Revenue Comparison: Arista Networks, Inc. vs Fiserv, Inc.
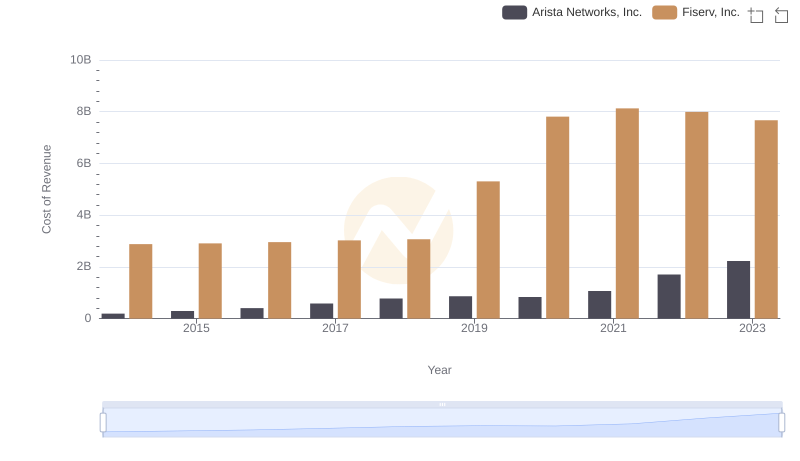
Analyzing Cost of Revenue: Arista Networks, Inc. and Fiserv, Inc.
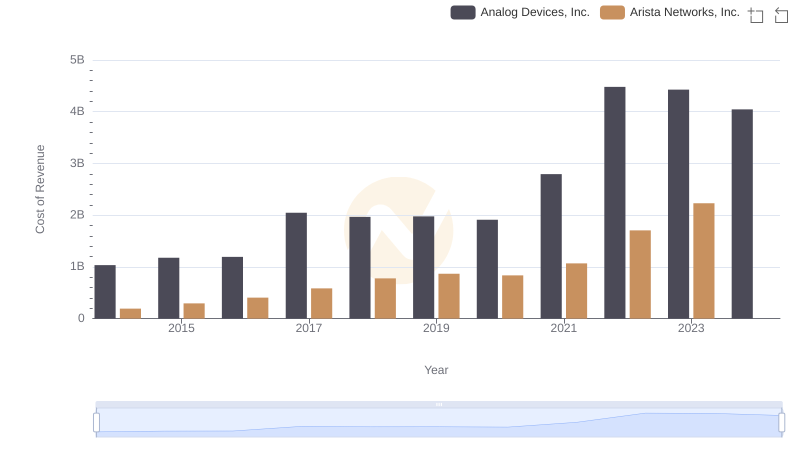
Arista Networks, Inc. vs Analog Devices, Inc.: Efficiency in Cost of Revenue Explored
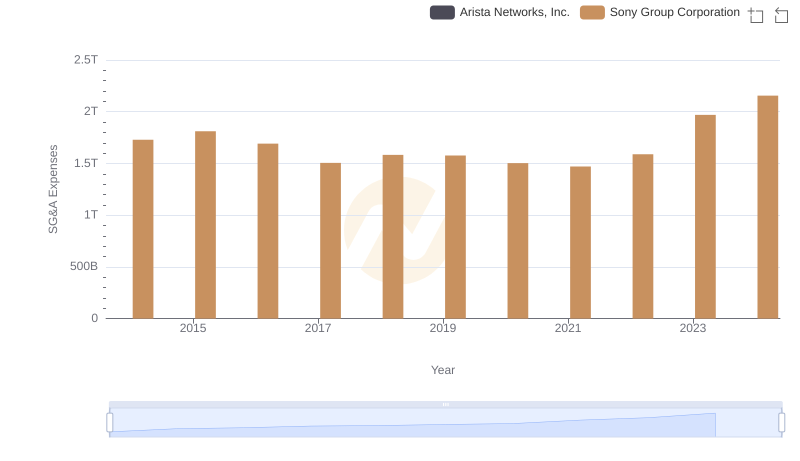
Comparing SG&A Expenses: Arista Networks, Inc. vs Sony Group Corporation Trends and Insights
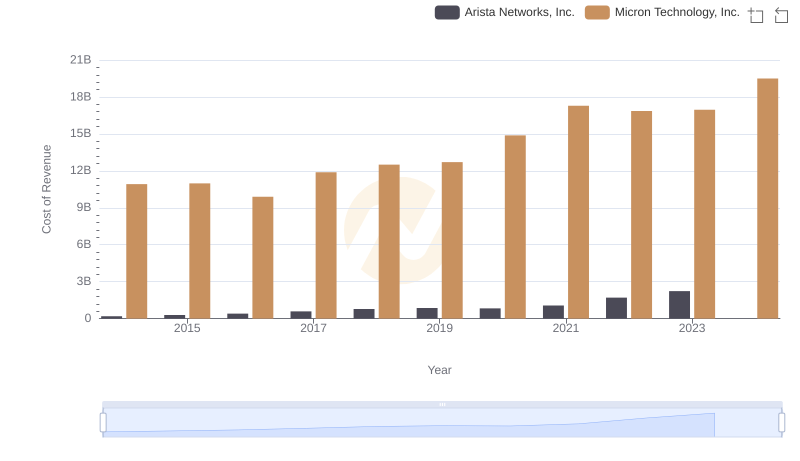
Cost of Revenue Comparison: Arista Networks, Inc. vs Micron Technology, Inc.
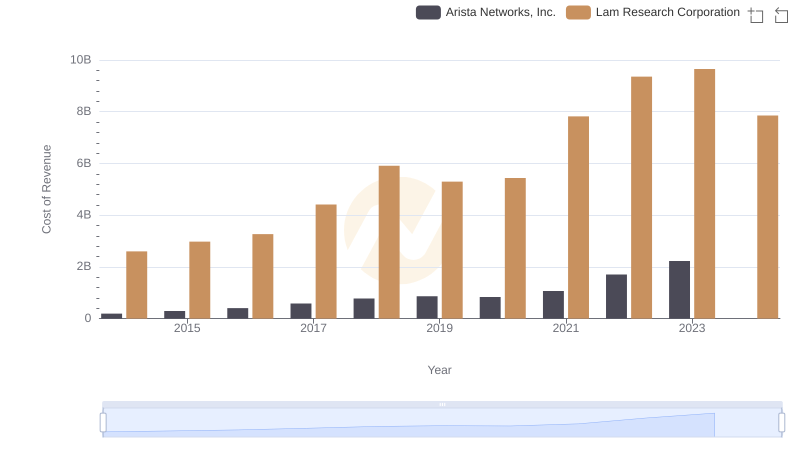
Cost of Revenue Trends: Arista Networks, Inc. vs Lam Research Corporation
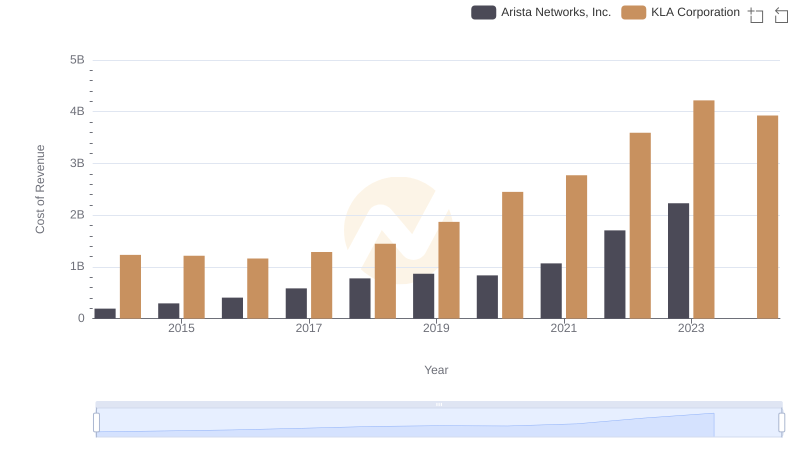
Cost of Revenue: Key Insights for Arista Networks, Inc. and KLA Corporation
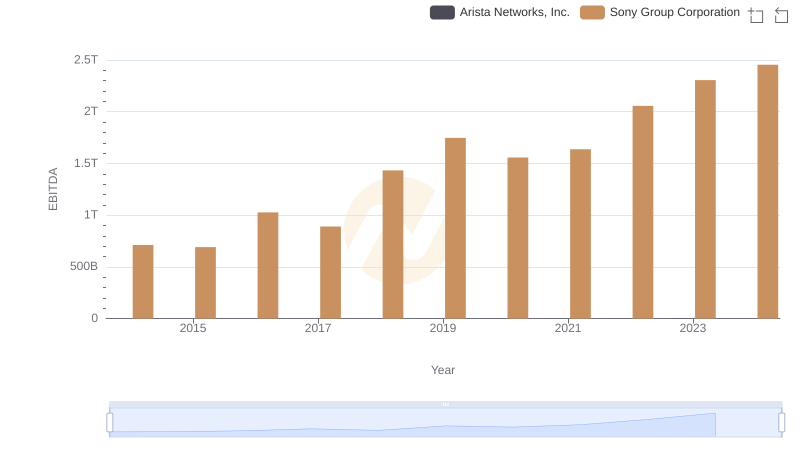
Arista Networks, Inc. and Sony Group Corporation: A Detailed Examination of EBITDA Performance
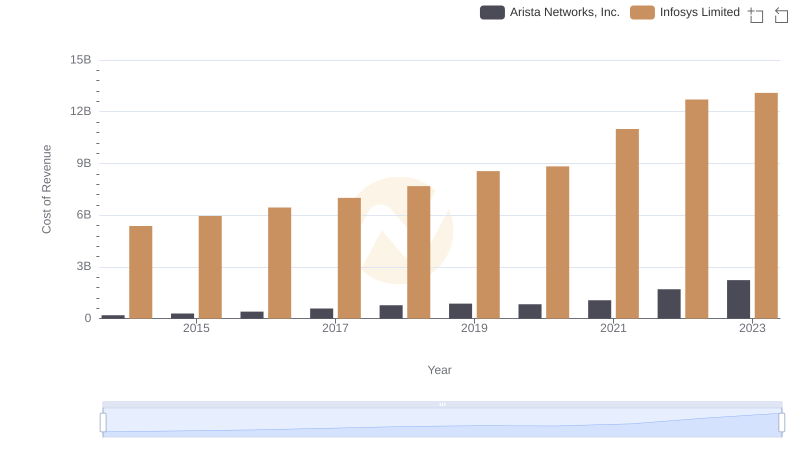
Analyzing Cost of Revenue: Arista Networks, Inc. and Infosys Limited