| __timestamp | Arista Networks, Inc. | Sony Group Corporation |
|---|---|---|
| Wednesday, January 1, 2014 | 117669000 | 1728520000000 |
| Thursday, January 1, 2015 | 184804000 | 1811461000000 |
| Friday, January 1, 2016 | 206126000 | 1691930000000 |
| Sunday, January 1, 2017 | 241903000 | 1505956000000 |
| Monday, January 1, 2018 | 252562000 | 1583197000000 |
| Tuesday, January 1, 2019 | 275805000 | 1576825000000 |
| Wednesday, January 1, 2020 | 295608000 | 1502625000000 |
| Friday, January 1, 2021 | 369288000 | 1469955000000 |
| Saturday, January 1, 2022 | 420196000 | 1588473000000 |
| Sunday, January 1, 2023 | 518114000 | 1969170000000 |
| Monday, January 1, 2024 | 549970000 | 2156156000000 |
Unleashing the power of data
In the ever-evolving landscape of global business, understanding the financial strategies of industry leaders is crucial. This analysis delves into the Selling, General, and Administrative (SG&A) expenses of Arista Networks, Inc. and Sony Group Corporation from 2014 to 2023. Over this period, Arista Networks has seen a remarkable increase in SG&A expenses, growing by approximately 340%, reflecting its aggressive expansion and scaling strategies. In contrast, Sony's SG&A expenses have remained relatively stable, with a modest increase of around 14%, indicating a more conservative approach to cost management.
The data reveals a fascinating divergence in financial strategies between a tech innovator and a diversified conglomerate. While Arista's expenses surged, Sony maintained a steady course, highlighting different paths to growth and market adaptation. This comparison offers valuable insights into how companies navigate financial planning in a competitive global market.
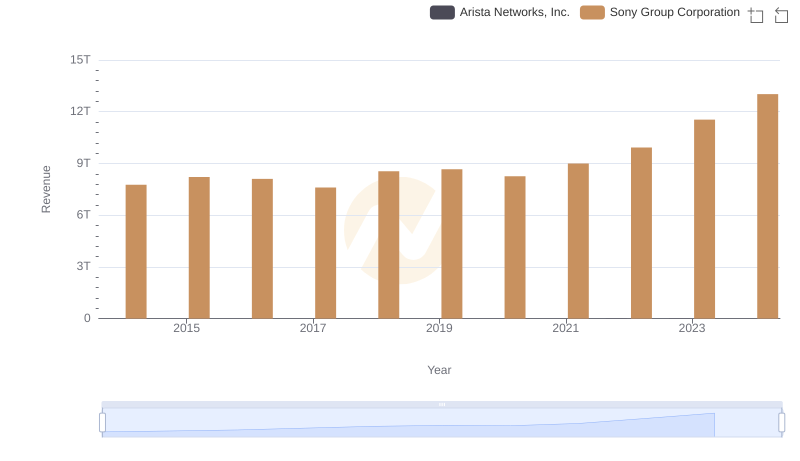
Annual Revenue Comparison: Arista Networks, Inc. vs Sony Group Corporation
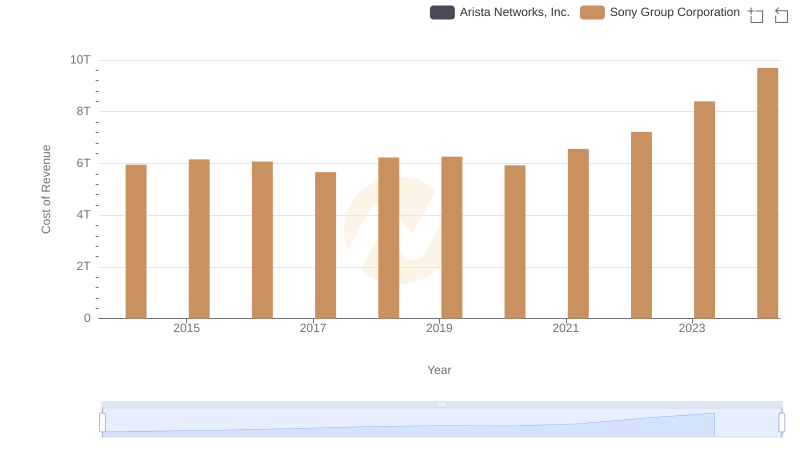
Analyzing Cost of Revenue: Arista Networks, Inc. and Sony Group Corporation
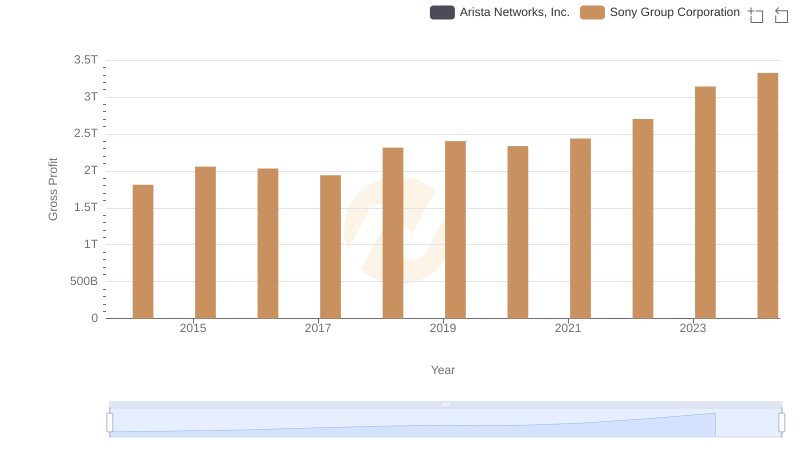
Arista Networks, Inc. vs Sony Group Corporation: A Gross Profit Performance Breakdown
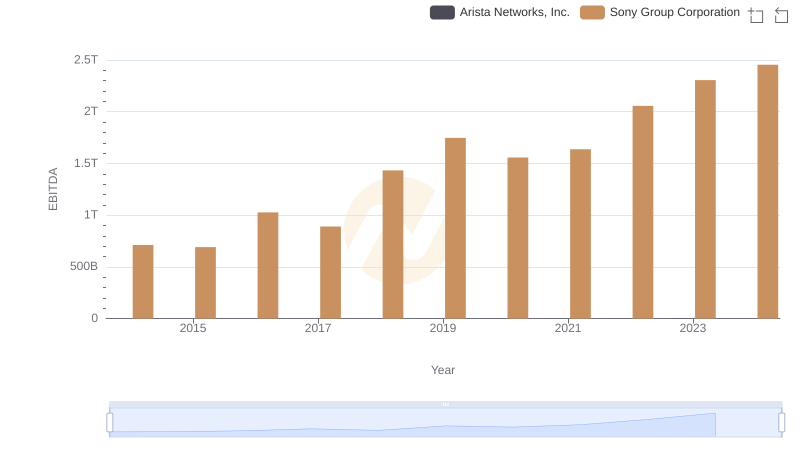
Arista Networks, Inc. and Sony Group Corporation: A Detailed Examination of EBITDA Performance

Cost Management Insights: SG&A Expenses for Arista Networks, Inc. and Fiserv, Inc.
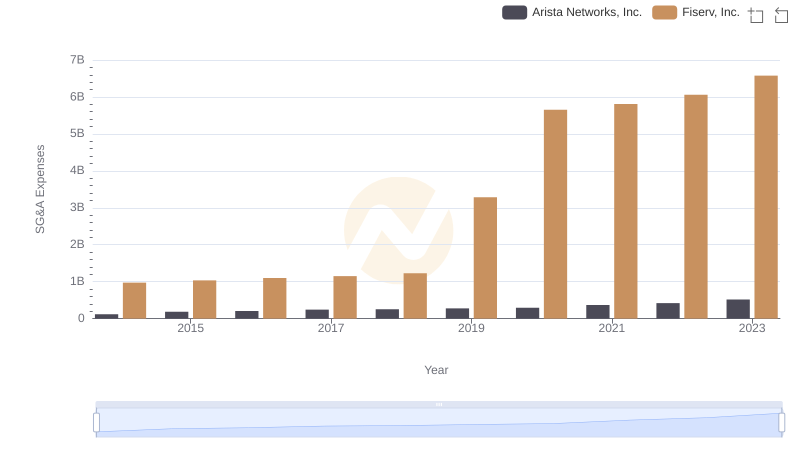
Cost Management Insights: SG&A Expenses for Arista Networks, Inc. and Fiserv, Inc.
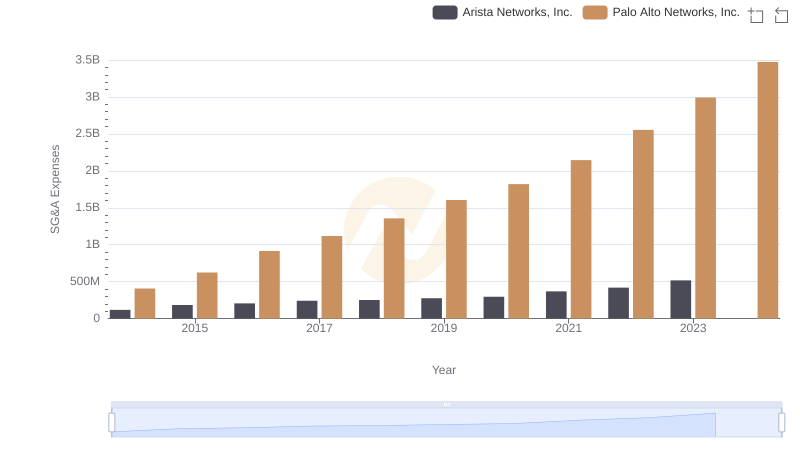
SG&A Efficiency Analysis: Comparing Arista Networks, Inc. and Palo Alto Networks, Inc.
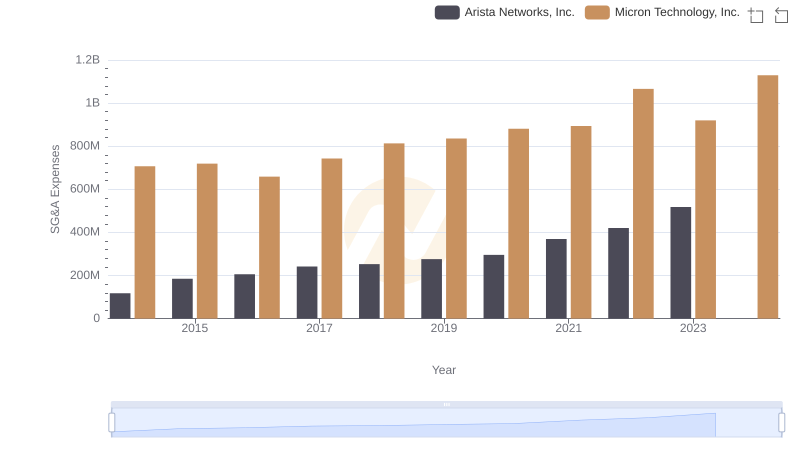
Comparing SG&A Expenses: Arista Networks, Inc. vs Micron Technology, Inc. Trends and Insights
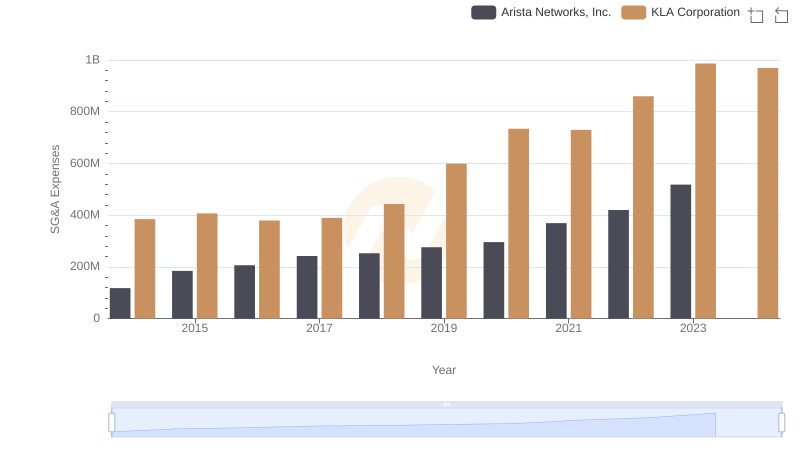
Arista Networks, Inc. or KLA Corporation: Who Manages SG&A Costs Better?
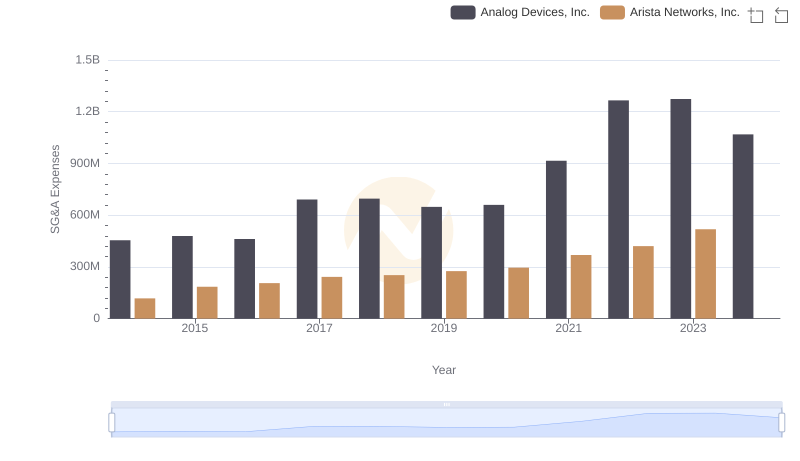
Selling, General, and Administrative Costs: Arista Networks, Inc. vs Analog Devices, Inc.
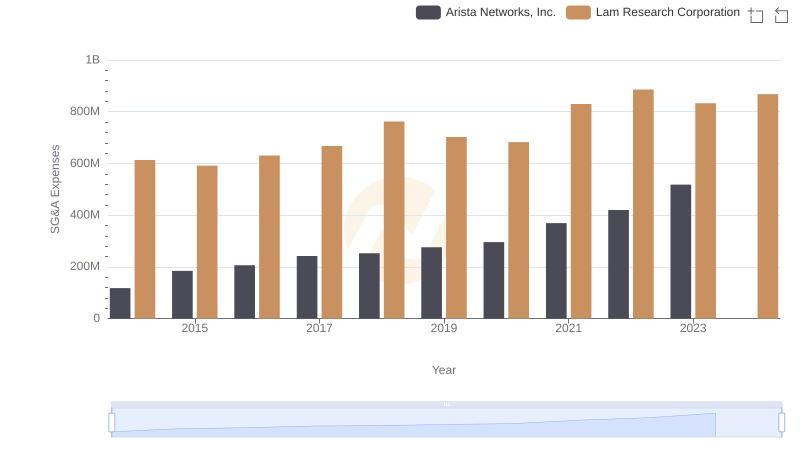
Selling, General, and Administrative Costs: Arista Networks, Inc. vs Lam Research Corporation
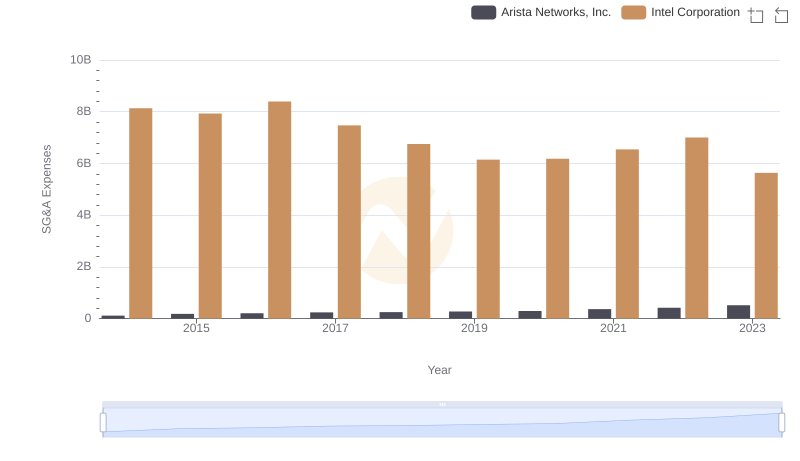
Comparing SG&A Expenses: Arista Networks, Inc. vs Intel Corporation Trends and Insights