| __timestamp | Arista Networks, Inc. | Sony Group Corporation |
|---|---|---|
| Wednesday, January 1, 2014 | 137809000 | 711569000000 |
| Thursday, January 1, 2015 | 162832000 | 690894000000 |
| Friday, January 1, 2016 | 265110000 | 1026468000000 |
| Sunday, January 1, 2017 | 498180000 | 890716000000 |
| Monday, January 1, 2018 | 318202000 | 1433333000000 |
| Tuesday, January 1, 2019 | 838623000 | 1746634000000 |
| Wednesday, January 1, 2020 | 699684000 | 1556991000000 |
| Friday, January 1, 2021 | 975073000 | 1637322000000 |
| Saturday, January 1, 2022 | 1589806000 | 2056876000000 |
| Sunday, January 1, 2023 | 2327879000 | 2305484000000 |
| Monday, January 1, 2024 | 2944616000 | 2454639000000 |
Data in motion
In the ever-evolving landscape of global technology and entertainment, Arista Networks, Inc. and Sony Group Corporation stand as titans of industry. From 2014 to 2023, Arista Networks has demonstrated a remarkable growth trajectory, with its EBITDA surging by over 1,500%, reflecting its robust expansion in the networking sector. Meanwhile, Sony Group Corporation, a stalwart in electronics and entertainment, has seen its EBITDA grow by approximately 224% during the same period, underscoring its resilience and adaptability in a competitive market.
This analysis provides a window into the strategic maneuvers and market dynamics that have shaped these industry leaders.
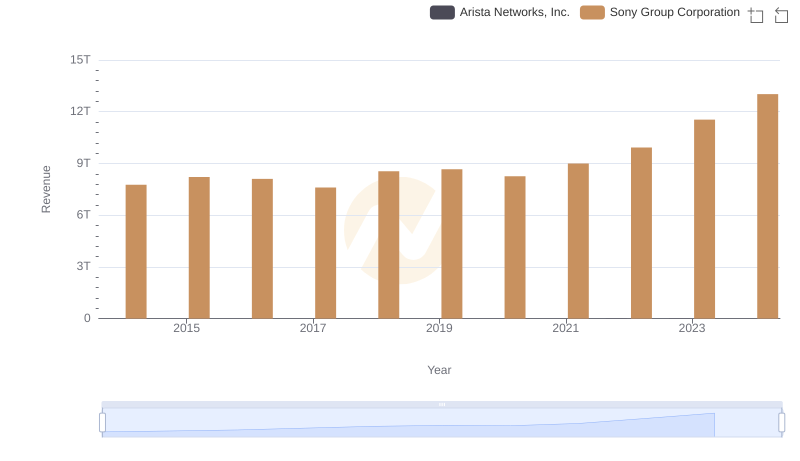
Annual Revenue Comparison: Arista Networks, Inc. vs Sony Group Corporation
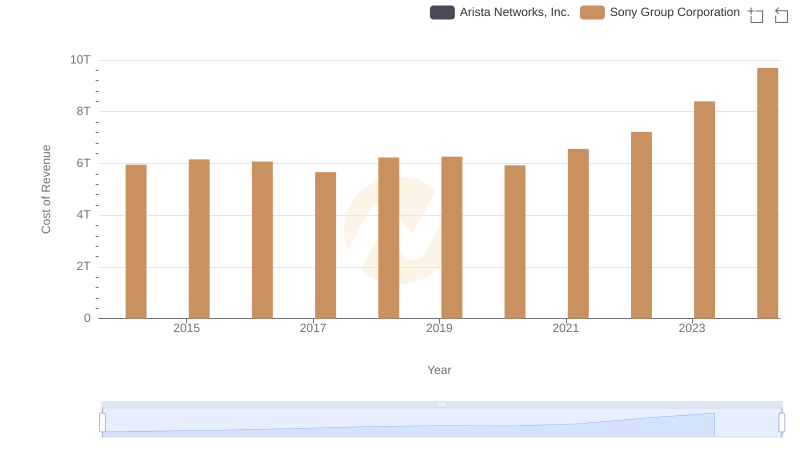
Analyzing Cost of Revenue: Arista Networks, Inc. and Sony Group Corporation
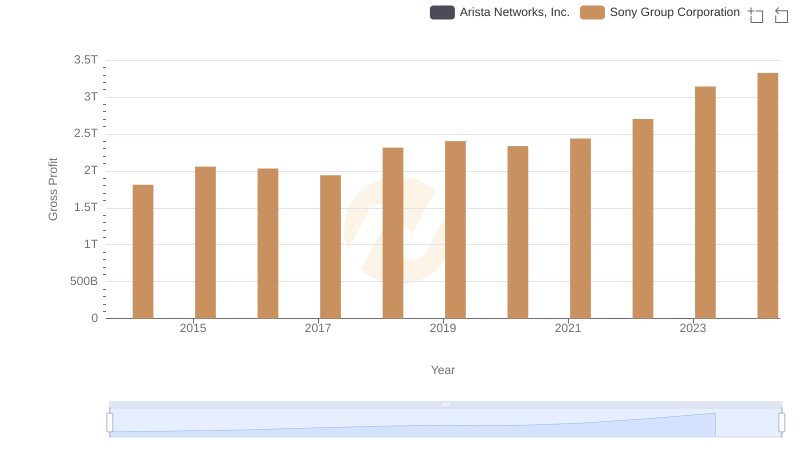
Arista Networks, Inc. vs Sony Group Corporation: A Gross Profit Performance Breakdown
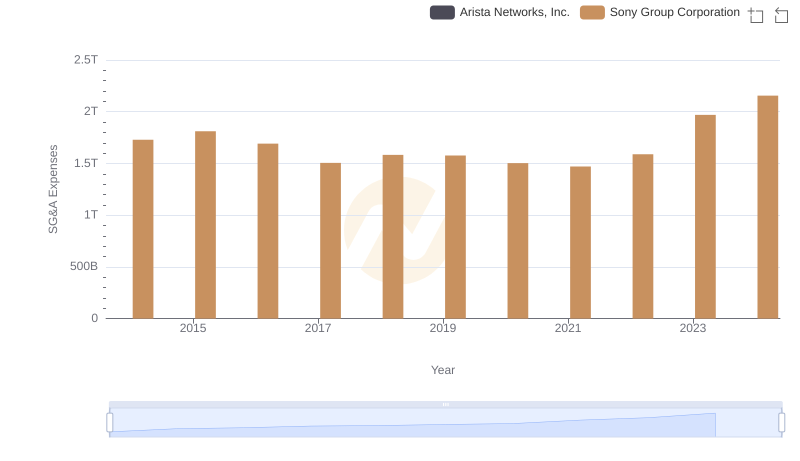
Comparing SG&A Expenses: Arista Networks, Inc. vs Sony Group Corporation Trends and Insights

EBITDA Analysis: Evaluating Arista Networks, Inc. Against Fiserv, Inc.
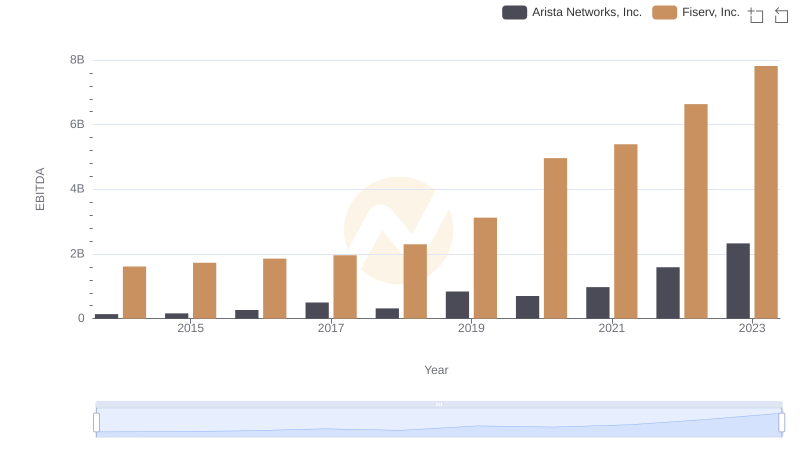
Arista Networks, Inc. vs Fiserv, Inc.: In-Depth EBITDA Performance Comparison

Comprehensive EBITDA Comparison: Arista Networks, Inc. vs Micron Technology, Inc.
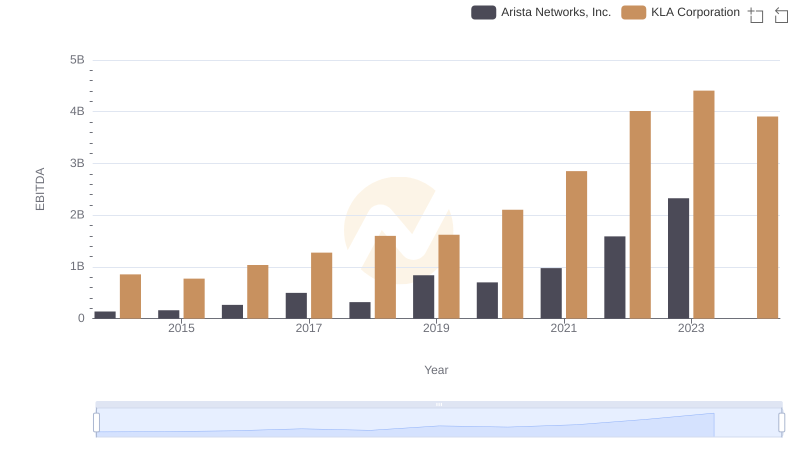
Arista Networks, Inc. and KLA Corporation: A Detailed Examination of EBITDA Performance
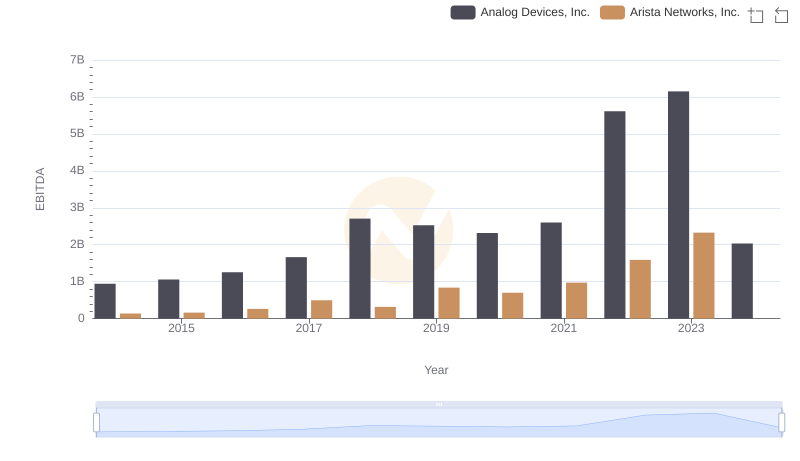
Arista Networks, Inc. vs Analog Devices, Inc.: In-Depth EBITDA Performance Comparison
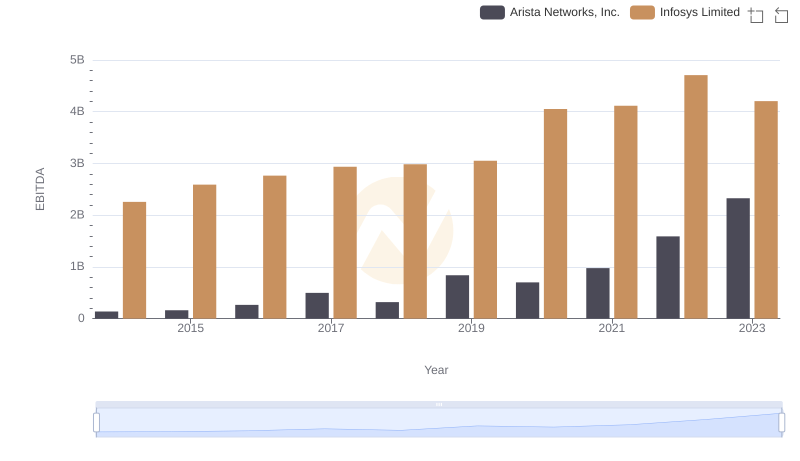
EBITDA Analysis: Evaluating Arista Networks, Inc. Against Infosys Limited
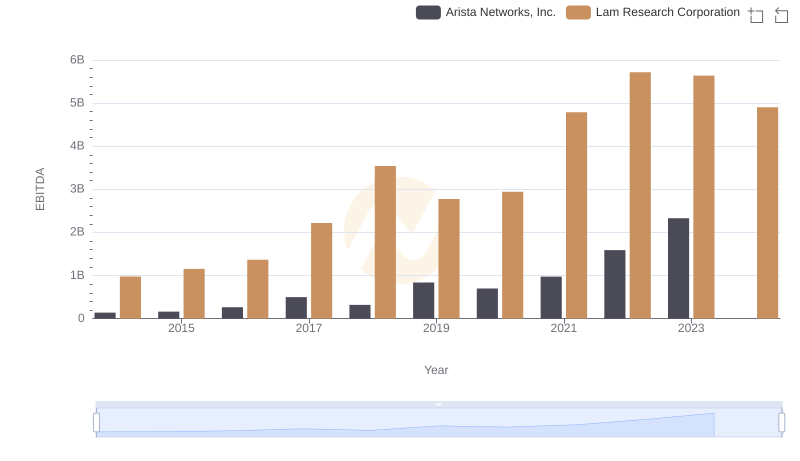
EBITDA Performance Review: Arista Networks, Inc. vs Lam Research Corporation
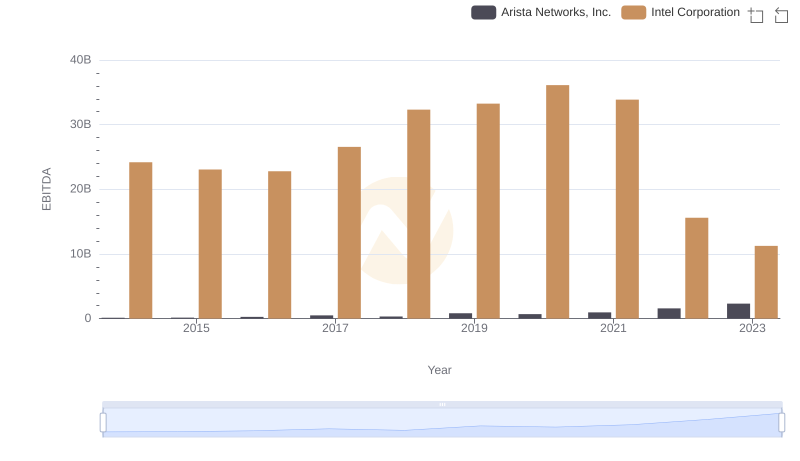
EBITDA Analysis: Evaluating Arista Networks, Inc. Against Intel Corporation