| __timestamp | Arista Networks, Inc. | Sony Group Corporation |
|---|---|---|
| Wednesday, January 1, 2014 | 392091000 | 1811055000000 |
| Thursday, January 1, 2015 | 543560000 | 2057746000000 |
| Friday, January 1, 2016 | 723116000 | 2031060000000 |
| Sunday, January 1, 2017 | 1061769000 | 1940096000000 |
| Monday, January 1, 2018 | 1373377000 | 2313560000000 |
| Tuesday, January 1, 2019 | 1544338000 | 2402491000000 |
| Wednesday, January 1, 2020 | 1481886000 | 2334836000000 |
| Friday, January 1, 2021 | 1880779000 | 2437801000000 |
| Saturday, January 1, 2022 | 2675696000 | 2701672000000 |
| Sunday, January 1, 2023 | 3630281000 | 3140906000000 |
| Monday, January 1, 2024 | 4491303000 | 3325081000000 |
Unleashing the power of data
In the ever-evolving landscape of global technology, Arista Networks, Inc. and Sony Group Corporation stand as titans, each with a unique trajectory in gross profit performance. From 2014 to 2023, Arista Networks has seen a staggering growth of over 800%, starting from a modest $392 million to an impressive $3.63 billion. This meteoric rise underscores Arista's strategic prowess in the networking sector.
Conversely, Sony Group Corporation, a stalwart in the electronics and entertainment industry, has maintained a robust gross profit, growing by approximately 73% over the same period, from $1.81 trillion to $3.14 trillion. This steady climb highlights Sony's resilience and adaptability in a competitive market.
While Arista's data for 2024 remains elusive, Sony continues its upward trend, projecting a gross profit of $3.33 trillion. This comparison not only showcases the dynamic nature of these companies but also offers a glimpse into the future of technological innovation.
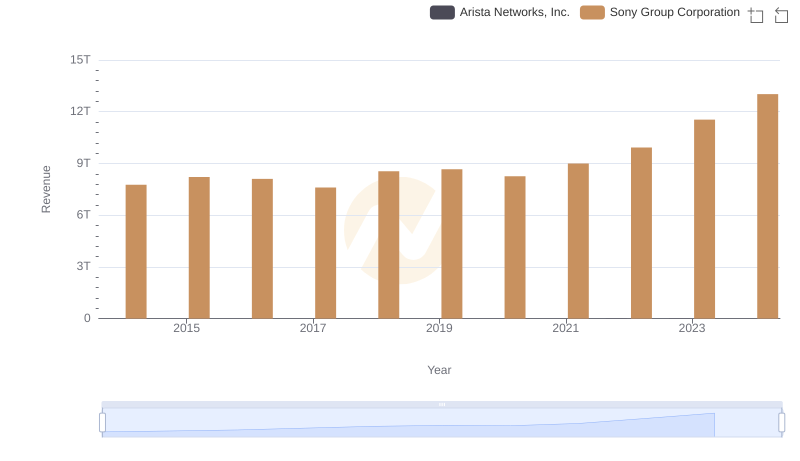
Annual Revenue Comparison: Arista Networks, Inc. vs Sony Group Corporation
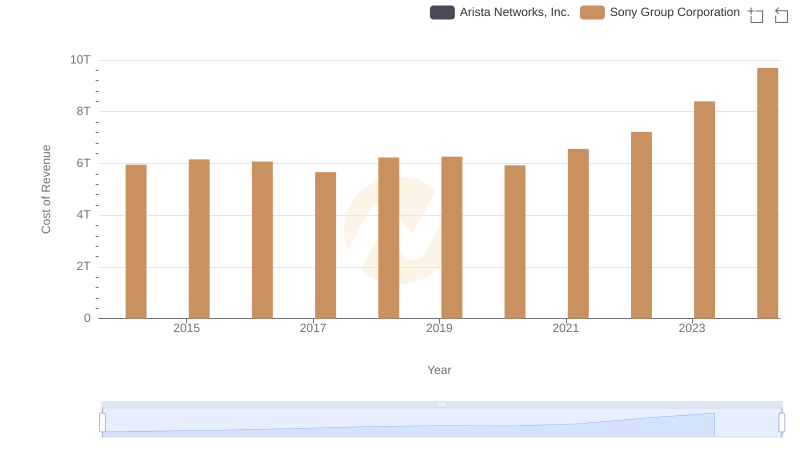
Analyzing Cost of Revenue: Arista Networks, Inc. and Sony Group Corporation
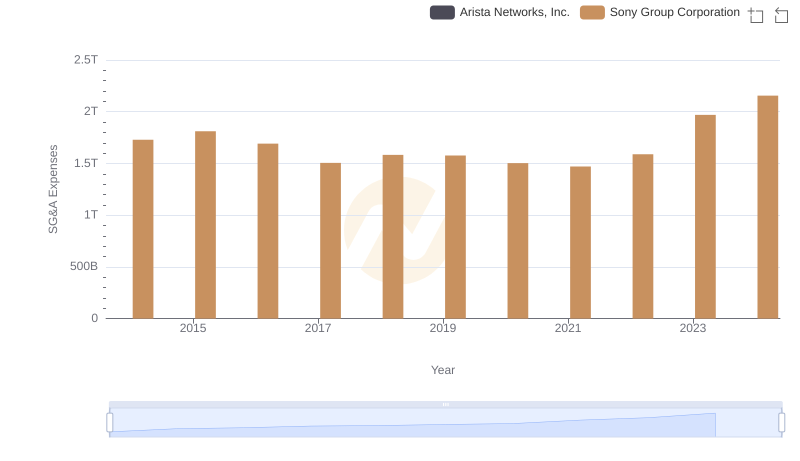
Comparing SG&A Expenses: Arista Networks, Inc. vs Sony Group Corporation Trends and Insights
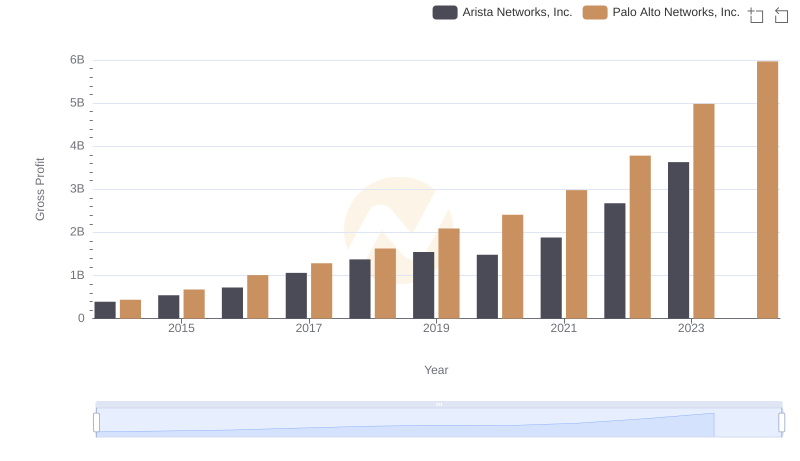
Gross Profit Analysis: Comparing Arista Networks, Inc. and Palo Alto Networks, Inc.

Who Generates Higher Gross Profit? Arista Networks, Inc. or Fiserv, Inc.
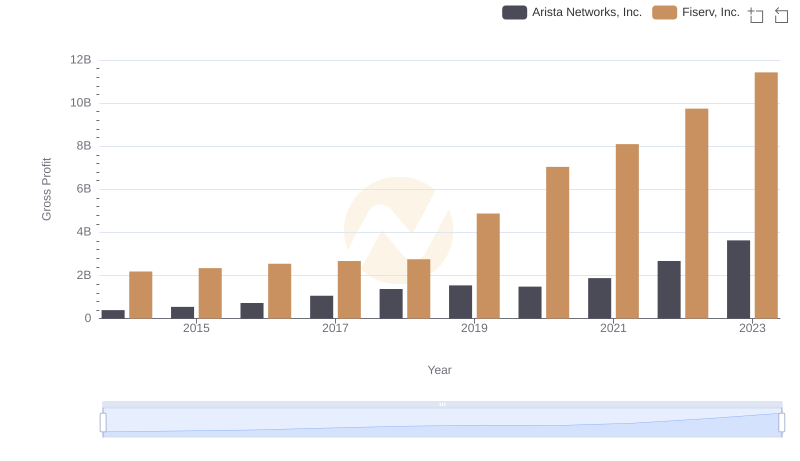
Key Insights on Gross Profit: Arista Networks, Inc. vs Fiserv, Inc.
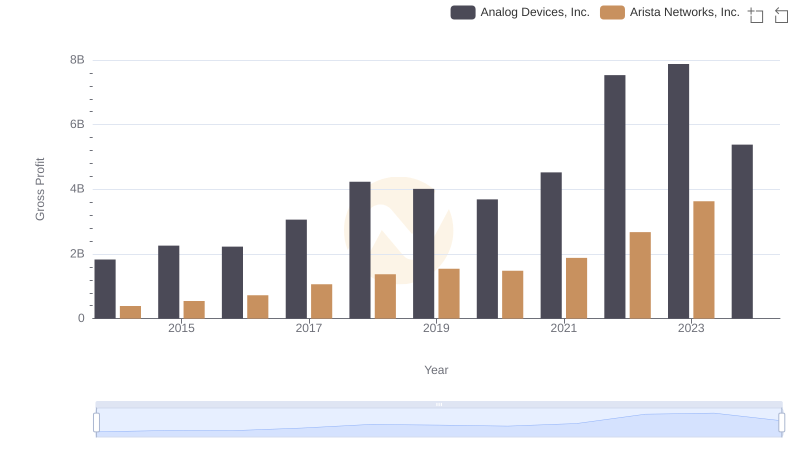
Key Insights on Gross Profit: Arista Networks, Inc. vs Analog Devices, Inc.
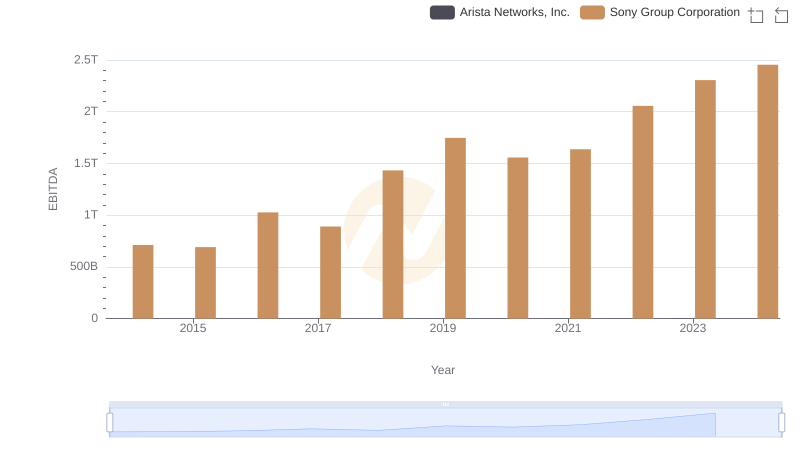
Arista Networks, Inc. and Sony Group Corporation: A Detailed Examination of EBITDA Performance
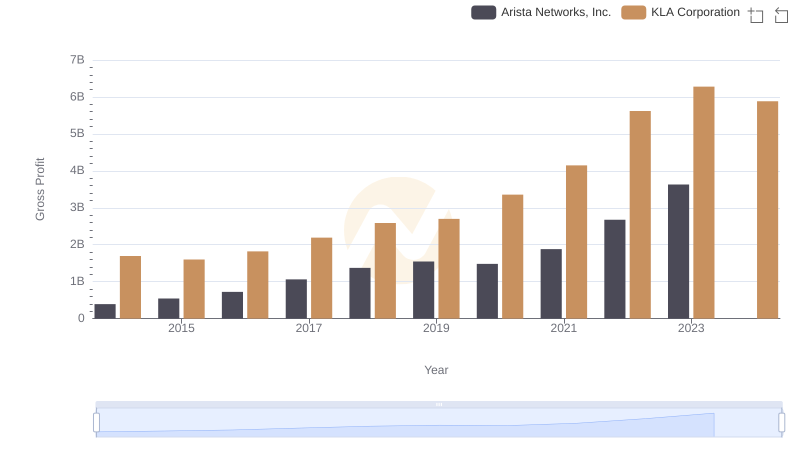
Gross Profit Comparison: Arista Networks, Inc. and KLA Corporation Trends
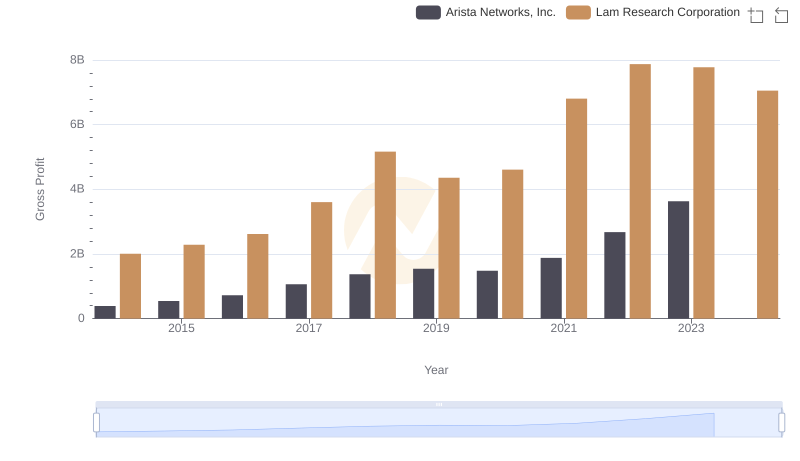
Arista Networks, Inc. and Lam Research Corporation: A Detailed Gross Profit Analysis
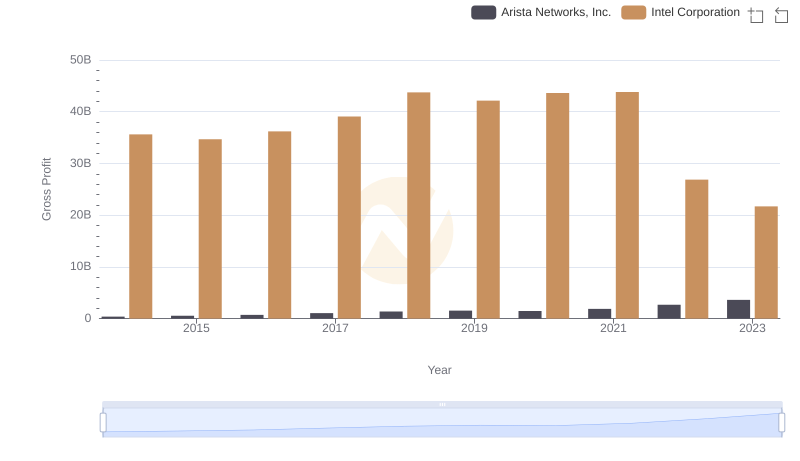
Arista Networks, Inc. and Intel Corporation: A Detailed Gross Profit Analysis
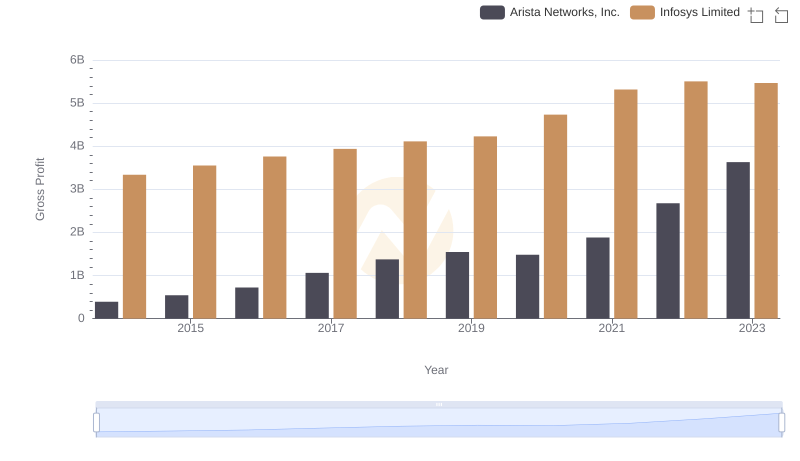
Gross Profit Trends Compared: Arista Networks, Inc. vs Infosys Limited