| __timestamp | Arista Networks, Inc. | Fiserv, Inc. |
|---|---|---|
| Wednesday, January 1, 2014 | 192015000 | 2881000000 |
| Thursday, January 1, 2015 | 294031000 | 2909000000 |
| Friday, January 1, 2016 | 406051000 | 2959000000 |
| Sunday, January 1, 2017 | 584417000 | 3024000000 |
| Monday, January 1, 2018 | 777992000 | 3069000000 |
| Tuesday, January 1, 2019 | 866368000 | 5309000000 |
| Wednesday, January 1, 2020 | 835626000 | 7812000000 |
| Friday, January 1, 2021 | 1067258000 | 8128000000 |
| Saturday, January 1, 2022 | 1705614000 | 7992000000 |
| Sunday, January 1, 2023 | 2229887000 | 7670000000 |
| Monday, January 1, 2024 | 2511843000 | 0 |
Unleashing the power of data
In the ever-evolving landscape of technology and financial services, understanding cost structures is crucial. Over the past decade, Arista Networks, Inc. and Fiserv, Inc. have showcased contrasting trajectories in their cost of revenue. From 2014 to 2023, Arista Networks saw a staggering increase of over 1,000% in its cost of revenue, reflecting its rapid expansion and scaling efforts. In contrast, Fiserv's cost of revenue grew by approximately 166%, highlighting its steady growth in the financial services sector.
These trends offer a window into the strategic priorities of these industry giants.

Revenue Insights: Arista Networks, Inc. and Fiserv, Inc. Performance Compared
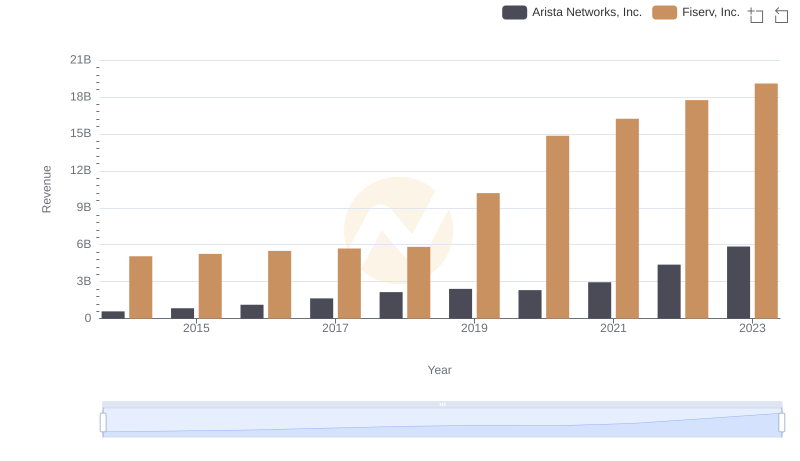
Arista Networks, Inc. vs Fiserv, Inc.: Examining Key Revenue Metrics
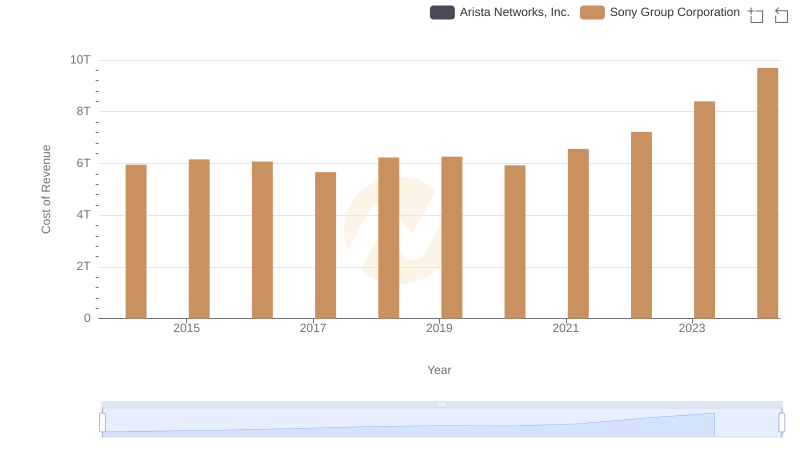
Analyzing Cost of Revenue: Arista Networks, Inc. and Sony Group Corporation
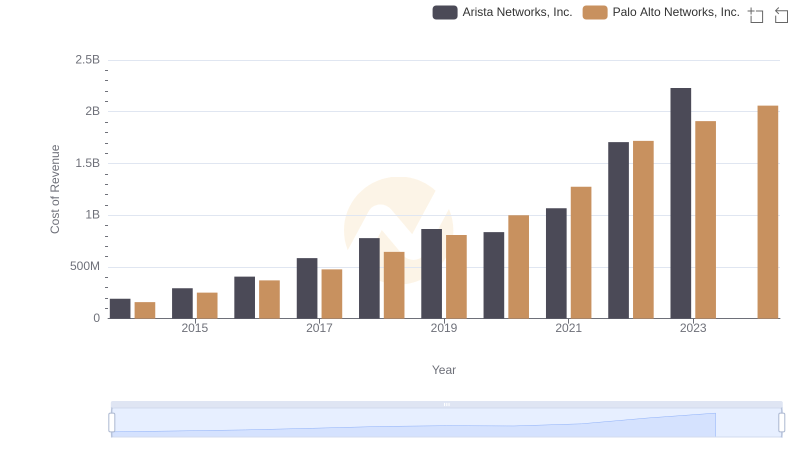
Cost of Revenue: Key Insights for Arista Networks, Inc. and Palo Alto Networks, Inc.
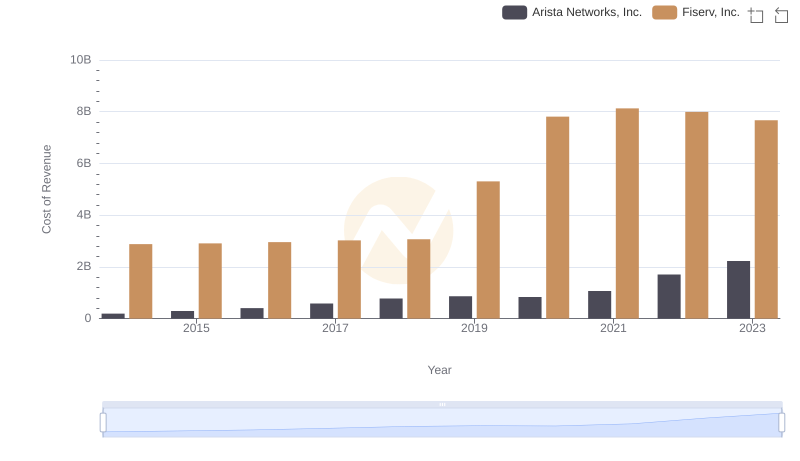
Analyzing Cost of Revenue: Arista Networks, Inc. and Fiserv, Inc.
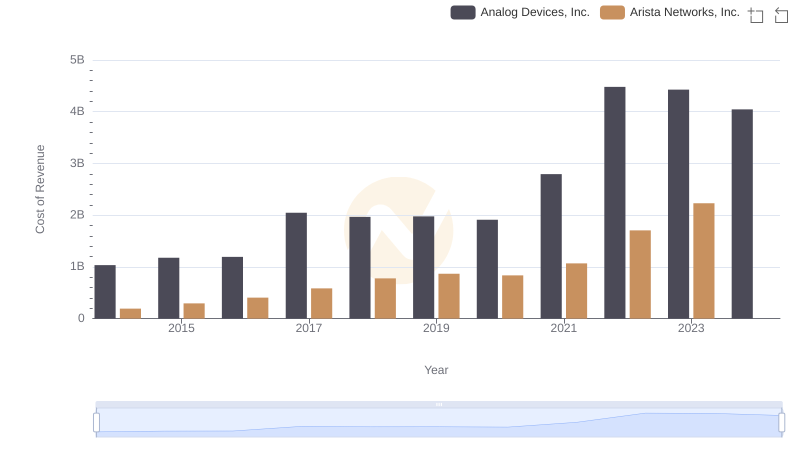
Arista Networks, Inc. vs Analog Devices, Inc.: Efficiency in Cost of Revenue Explored

Who Generates Higher Gross Profit? Arista Networks, Inc. or Fiserv, Inc.
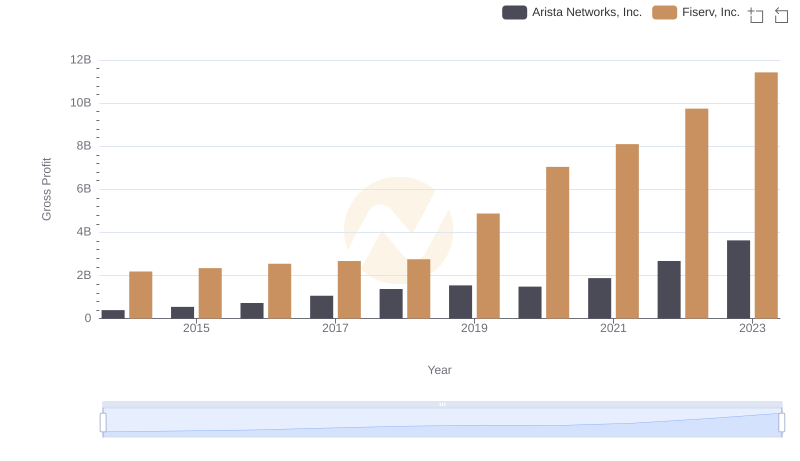
Key Insights on Gross Profit: Arista Networks, Inc. vs Fiserv, Inc.

Cost Management Insights: SG&A Expenses for Arista Networks, Inc. and Fiserv, Inc.
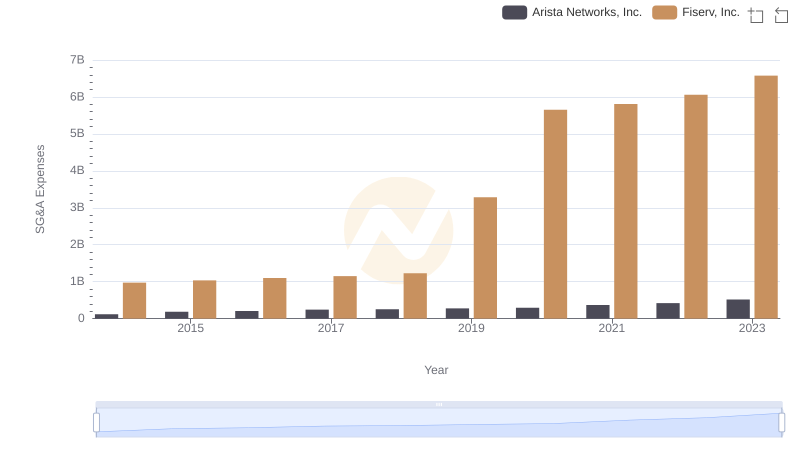
Cost Management Insights: SG&A Expenses for Arista Networks, Inc. and Fiserv, Inc.

EBITDA Analysis: Evaluating Arista Networks, Inc. Against Fiserv, Inc.
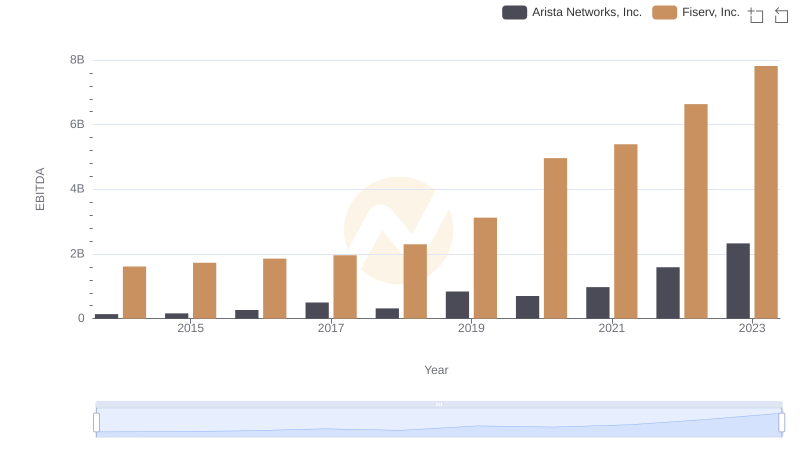
Arista Networks, Inc. vs Fiserv, Inc.: In-Depth EBITDA Performance Comparison