| __timestamp | Arista Networks, Inc. | Palo Alto Networks, Inc. |
|---|---|---|
| Wednesday, January 1, 2014 | 192015000 | 159628000 |
| Thursday, January 1, 2015 | 294031000 | 251499000 |
| Friday, January 1, 2016 | 406051000 | 370000000 |
| Sunday, January 1, 2017 | 584417000 | 476600000 |
| Monday, January 1, 2018 | 777992000 | 645300000 |
| Tuesday, January 1, 2019 | 866368000 | 808400000 |
| Wednesday, January 1, 2020 | 835626000 | 999500000 |
| Friday, January 1, 2021 | 1067258000 | 1274900000 |
| Saturday, January 1, 2022 | 1705614000 | 1718700000 |
| Sunday, January 1, 2023 | 2229887000 | 1909700000 |
| Monday, January 1, 2024 | 2511843000 | 2059199999 |
Unveiling the hidden dimensions of data
In the ever-evolving tech landscape, understanding cost structures is crucial for investors and analysts alike. Arista Networks and Palo Alto Networks, two giants in the networking and cybersecurity sectors, have shown intriguing trends in their cost of revenue from 2014 to 2023. Arista Networks saw a staggering increase of over 1,000% in their cost of revenue, peaking at approximately $2.23 billion in 2023. Meanwhile, Palo Alto Networks experienced a consistent rise, culminating in a 1,100% increase, reaching around $1.91 billion in the same year. This growth reflects their aggressive market expansion and investment in cutting-edge technologies. However, the data for 2024 is incomplete, indicating potential shifts in financial strategies. As these companies continue to innovate, monitoring their cost efficiency will be key to understanding their competitive edge.
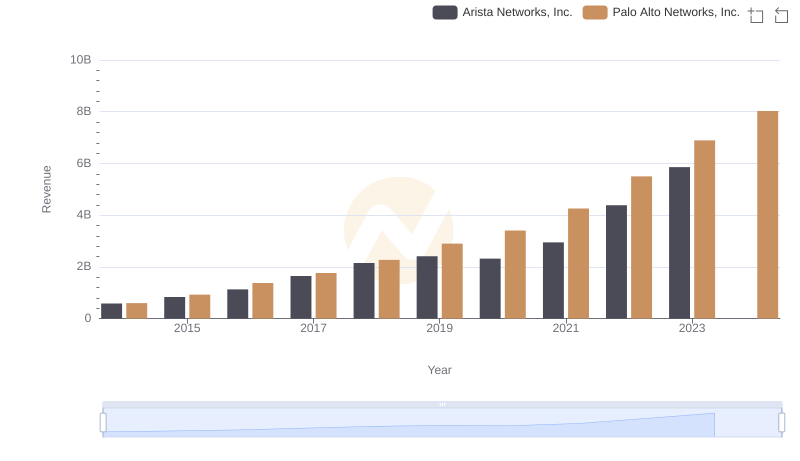
Revenue Showdown: Arista Networks, Inc. vs Palo Alto Networks, Inc.
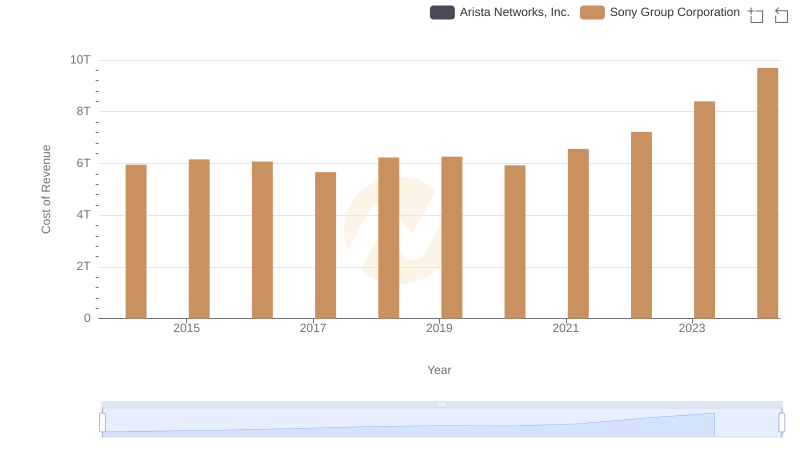
Analyzing Cost of Revenue: Arista Networks, Inc. and Sony Group Corporation

Cost of Revenue Comparison: Arista Networks, Inc. vs Fiserv, Inc.
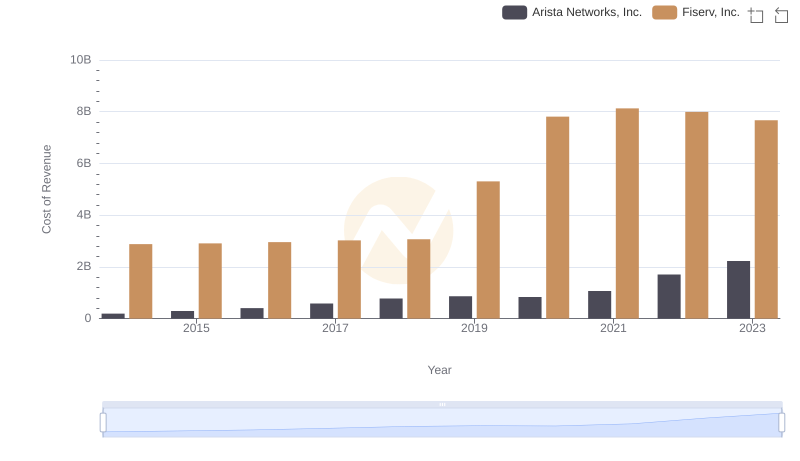
Analyzing Cost of Revenue: Arista Networks, Inc. and Fiserv, Inc.
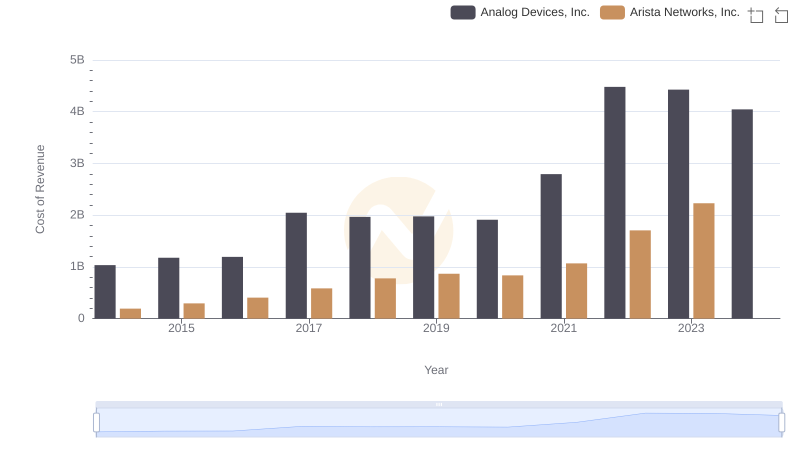
Arista Networks, Inc. vs Analog Devices, Inc.: Efficiency in Cost of Revenue Explored
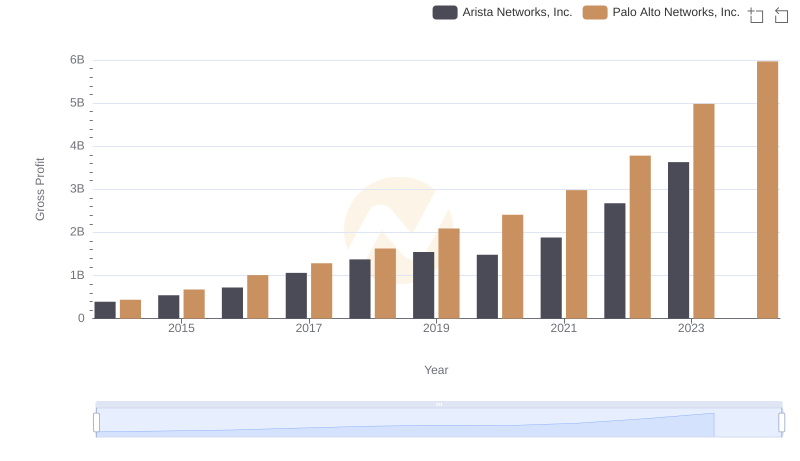
Gross Profit Analysis: Comparing Arista Networks, Inc. and Palo Alto Networks, Inc.
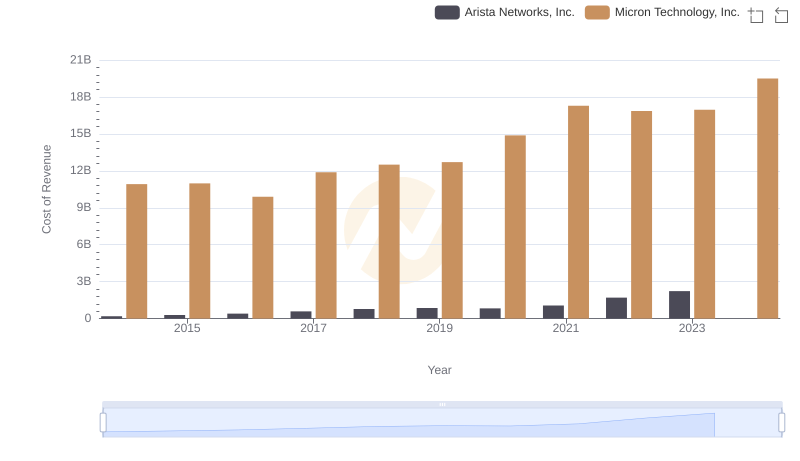
Cost of Revenue Comparison: Arista Networks, Inc. vs Micron Technology, Inc.
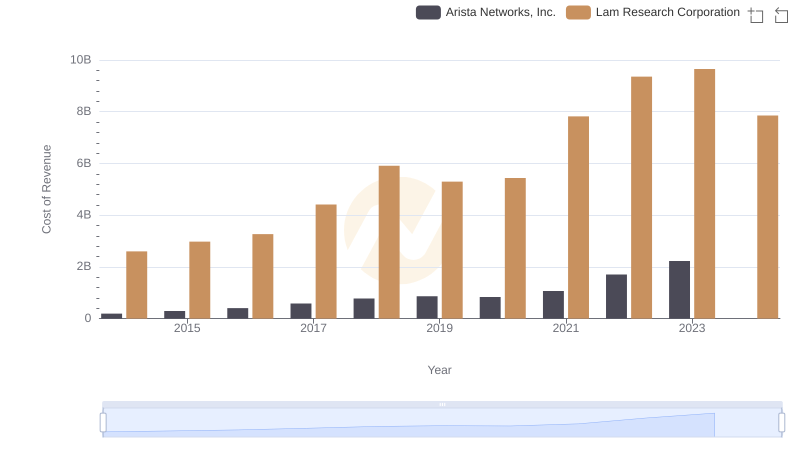
Cost of Revenue Trends: Arista Networks, Inc. vs Lam Research Corporation
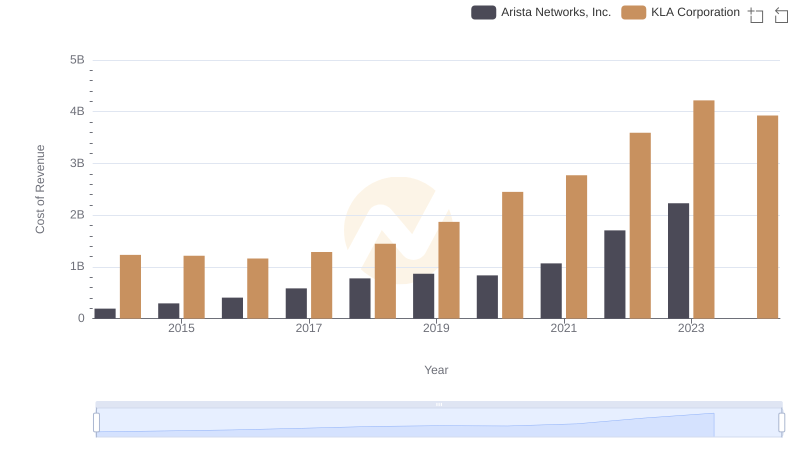
Cost of Revenue: Key Insights for Arista Networks, Inc. and KLA Corporation
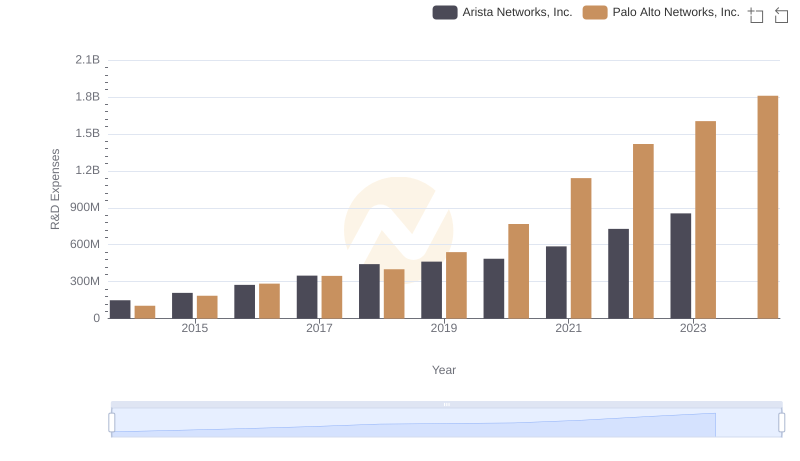
Who Prioritizes Innovation? R&D Spending Compared for Arista Networks, Inc. and Palo Alto Networks, Inc.
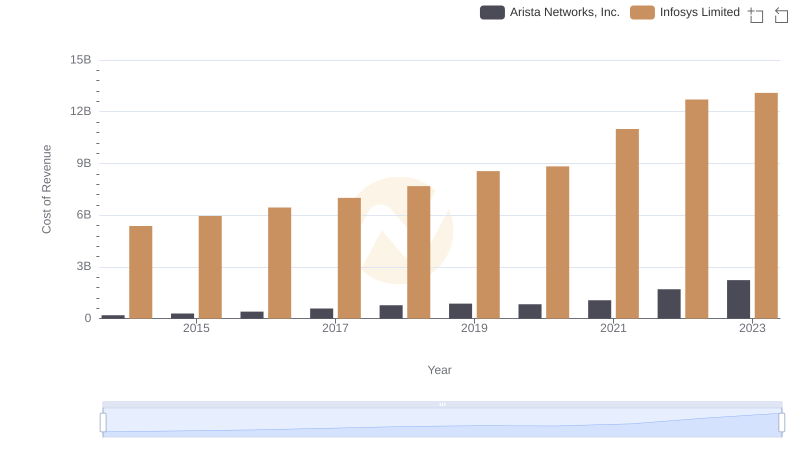
Analyzing Cost of Revenue: Arista Networks, Inc. and Infosys Limited
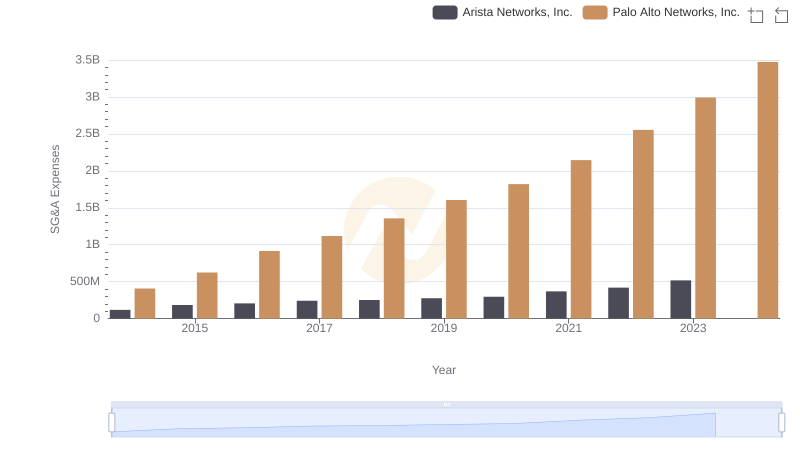
SG&A Efficiency Analysis: Comparing Arista Networks, Inc. and Palo Alto Networks, Inc.