| __timestamp | Old Dominion Freight Line, Inc. | TransUnion |
|---|---|---|
| Wednesday, January 1, 2014 | 2787897000 | 1304700000 |
| Thursday, January 1, 2015 | 2972442000 | 1506800000 |
| Friday, January 1, 2016 | 2991517000 | 1704900000 |
| Sunday, January 1, 2017 | 3358112000 | 1933800000 |
| Monday, January 1, 2018 | 4043695000 | 2317200000 |
| Tuesday, January 1, 2019 | 4109111000 | 2656100000 |
| Wednesday, January 1, 2020 | 4015129000 | 2716600000 |
| Friday, January 1, 2021 | 5256328000 | 2960200000 |
| Saturday, January 1, 2022 | 6260077000 | 3709900000 |
| Sunday, January 1, 2023 | 5866152000 | 3831200000 |
| Monday, January 1, 2024 | 4183800000 |
Unleashing insights
In the ever-evolving landscape of American business, Old Dominion Freight Line, Inc. and TransUnion have carved distinct paths in their respective industries. From 2014 to 2023, Old Dominion Freight Line, Inc. has demonstrated a robust revenue growth of approximately 110%, starting from $2.79 billion to peaking at $6.26 billion in 2022. This growth trajectory underscores the company's resilience and strategic prowess in the freight and logistics sector.
Conversely, TransUnion, a leader in credit reporting, has seen its revenue nearly triple, growing from $1.30 billion in 2014 to $3.83 billion in 2023. This steady climb highlights the increasing demand for credit information services in a data-driven economy.
Both companies have shown remarkable adaptability, with Old Dominion Freight Line, Inc. experiencing a slight dip in 2023, while TransUnion continued its upward trend. These insights offer a glimpse into the dynamic nature of revenue generation in diverse sectors.
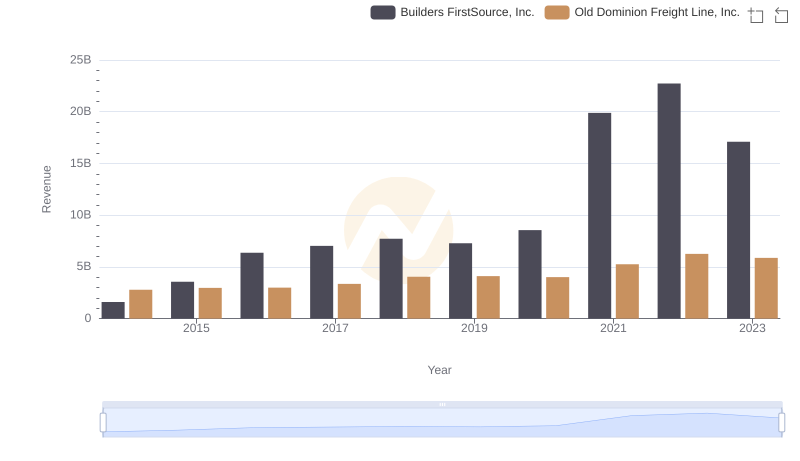
Comparing Revenue Performance: Old Dominion Freight Line, Inc. or Builders FirstSource, Inc.?
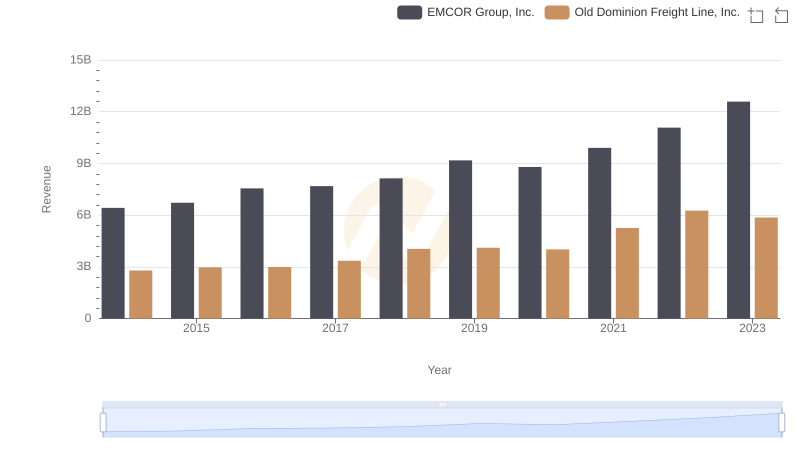
Who Generates More Revenue? Old Dominion Freight Line, Inc. or EMCOR Group, Inc.
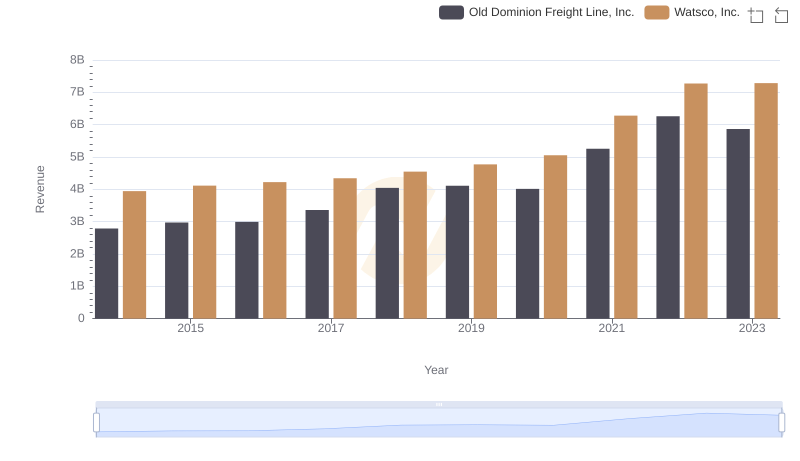
Revenue Showdown: Old Dominion Freight Line, Inc. vs Watsco, Inc.
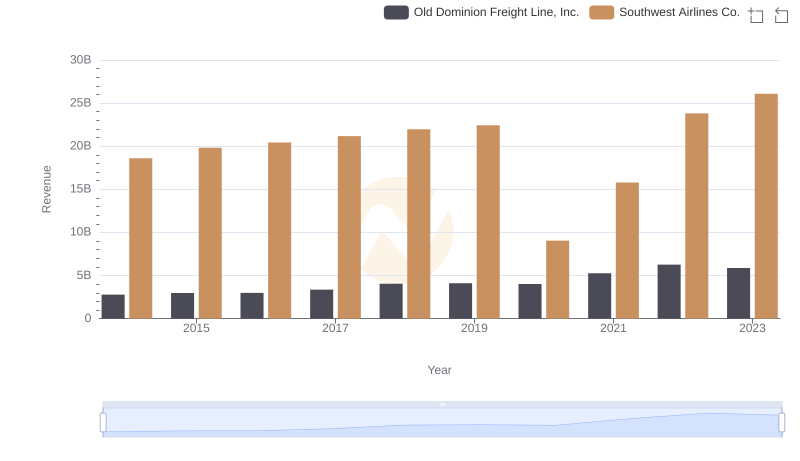
Old Dominion Freight Line, Inc. or Southwest Airlines Co.: Who Leads in Yearly Revenue?
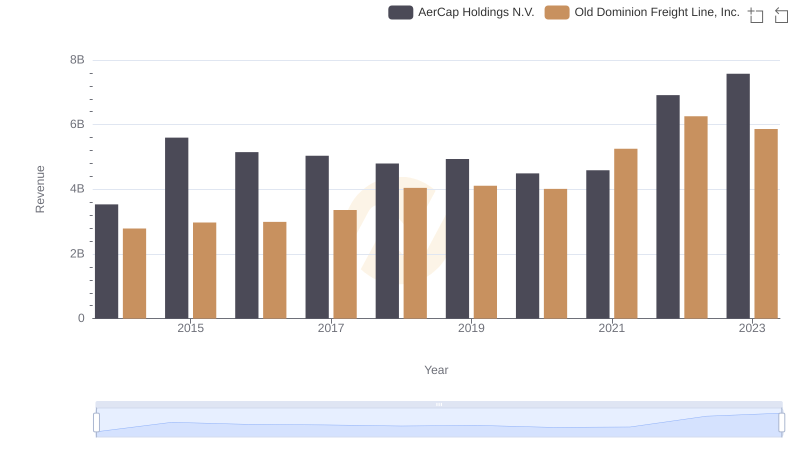
Old Dominion Freight Line, Inc. vs AerCap Holdings N.V.: Examining Key Revenue Metrics
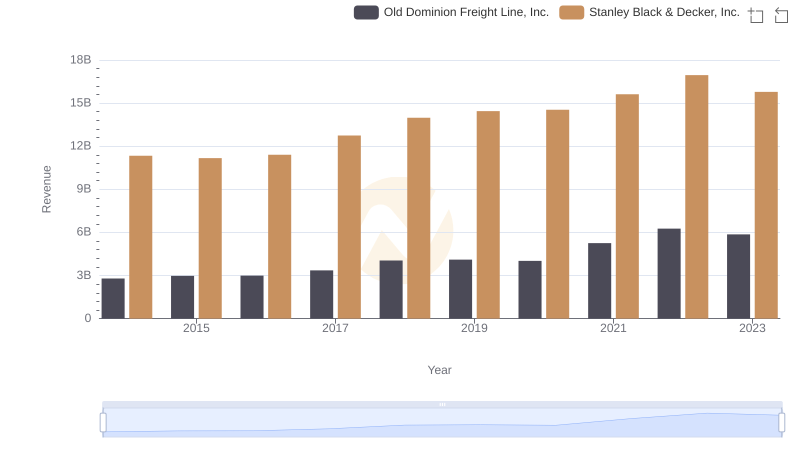
Comparing Revenue Performance: Old Dominion Freight Line, Inc. or Stanley Black & Decker, Inc.?
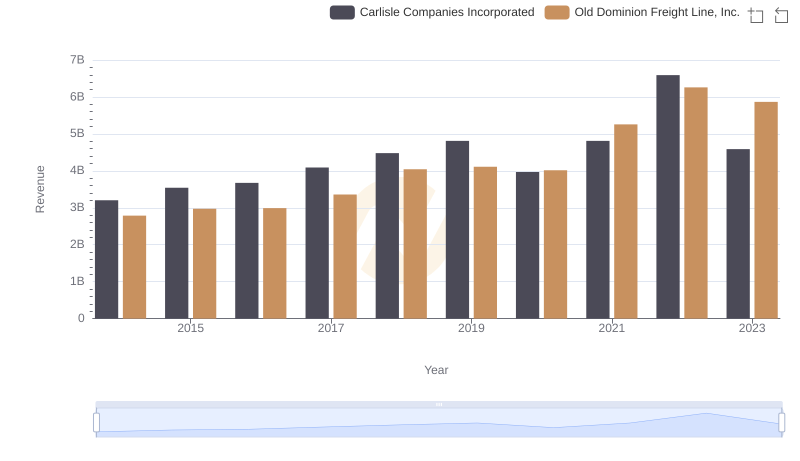
Old Dominion Freight Line, Inc. vs Carlisle Companies Incorporated: Annual Revenue Growth Compared
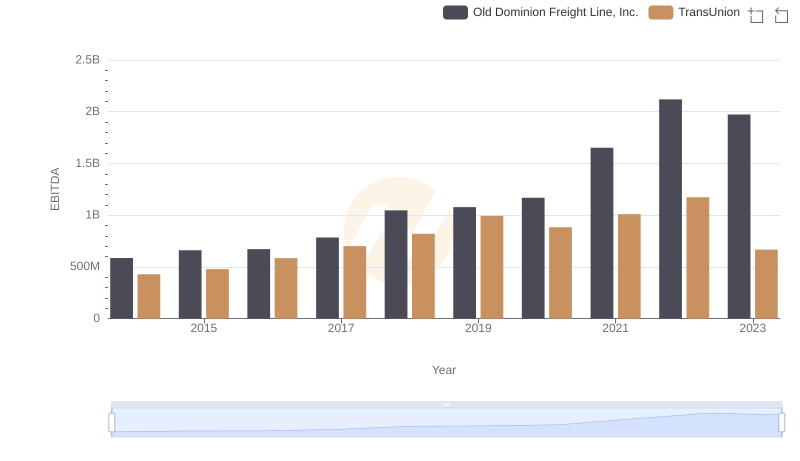
A Side-by-Side Analysis of EBITDA: Old Dominion Freight Line, Inc. and TransUnion