| __timestamp | American Airlines Group Inc. | W.W. Grainger, Inc. |
|---|---|---|
| Wednesday, January 1, 2014 | 31939000000 | 5650711000 |
| Thursday, January 1, 2015 | 27967000000 | 5741956000 |
| Friday, January 1, 2016 | 28339000000 | 6022647000 |
| Sunday, January 1, 2017 | 31154000000 | 6327301000 |
| Monday, January 1, 2018 | 34490000000 | 6873000000 |
| Tuesday, January 1, 2019 | 35379000000 | 7089000000 |
| Wednesday, January 1, 2020 | 24933000000 | 7559000000 |
| Friday, January 1, 2021 | 29855000000 | 8302000000 |
| Saturday, January 1, 2022 | 39934000000 | 9379000000 |
| Sunday, January 1, 2023 | 40978000000 | 9982000000 |
| Monday, January 1, 2024 | 10410000000 |
Unleashing insights
In the ever-evolving landscape of corporate efficiency, the cost of revenue is a critical metric. From 2014 to 2023, American Airlines Group Inc. and W.W. Grainger, Inc. have showcased contrasting trends in managing this crucial financial aspect. American Airlines, a titan in the aviation industry, saw its cost of revenue fluctuate, peaking at approximately $41 billion in 2023, a 28% increase from 2014. Meanwhile, W.W. Grainger, a leader in industrial supply, demonstrated a steady rise, reaching nearly $10 billion in 2023, marking a 77% growth over the same period. This comparison highlights the diverse challenges and strategies in different sectors. While American Airlines navigates the volatile skies of fuel prices and operational costs, Grainger focuses on optimizing supply chain efficiencies. Understanding these dynamics offers valuable insights into the strategic maneuvers of these industry giants.
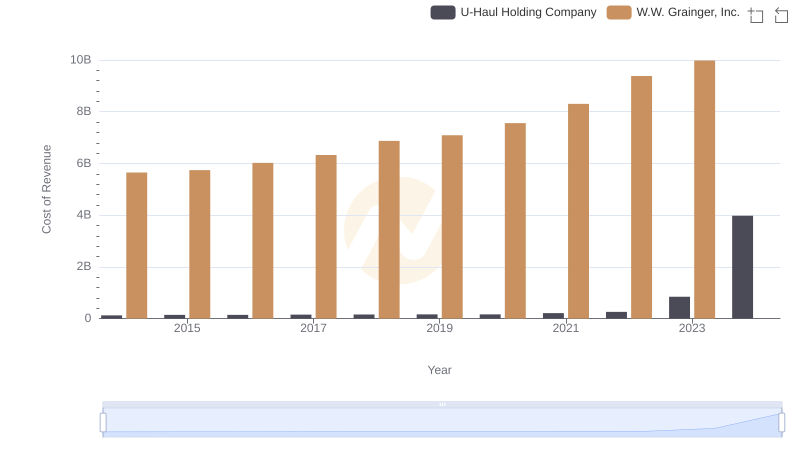
Comparing Cost of Revenue Efficiency: W.W. Grainger, Inc. vs U-Haul Holding Company
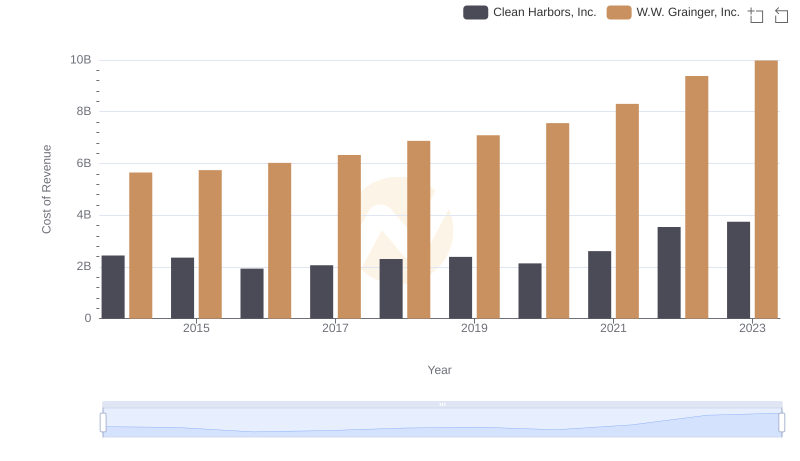
Cost of Revenue: Key Insights for W.W. Grainger, Inc. and Clean Harbors, Inc.
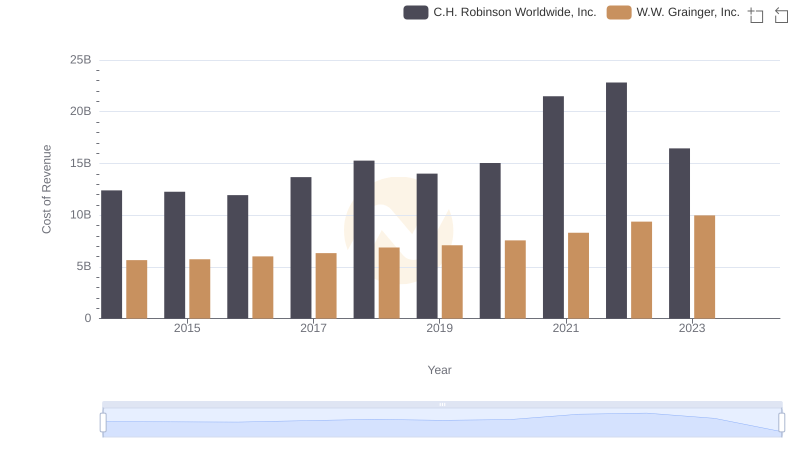
Cost of Revenue Trends: W.W. Grainger, Inc. vs C.H. Robinson Worldwide, Inc.
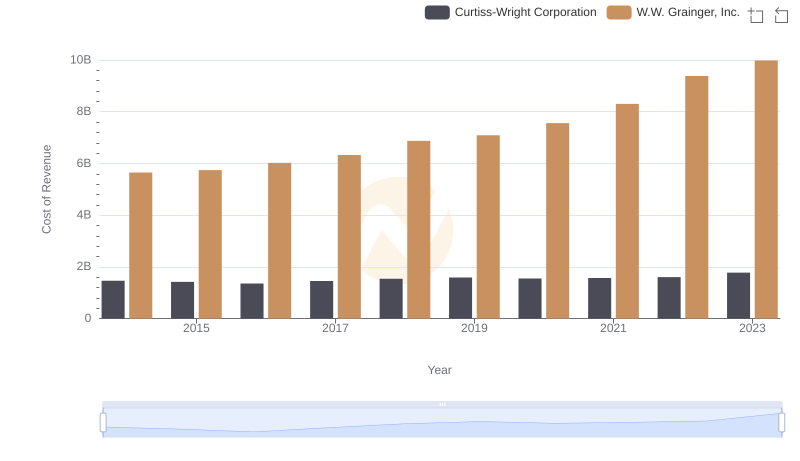
W.W. Grainger, Inc. vs Curtiss-Wright Corporation: Efficiency in Cost of Revenue Explored
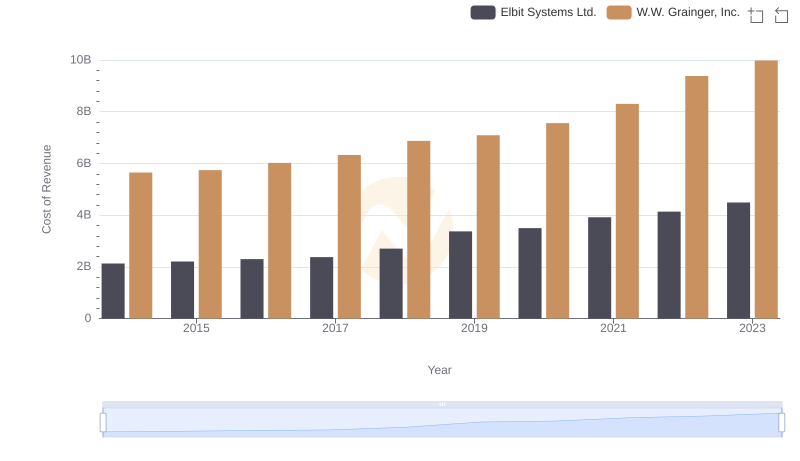
W.W. Grainger, Inc. vs Elbit Systems Ltd.: Efficiency in Cost of Revenue Explored
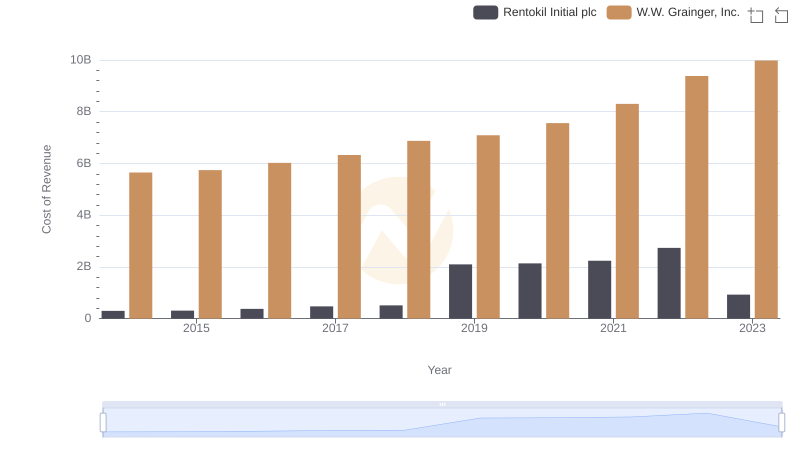
Comparing Cost of Revenue Efficiency: W.W. Grainger, Inc. vs Rentokil Initial plc
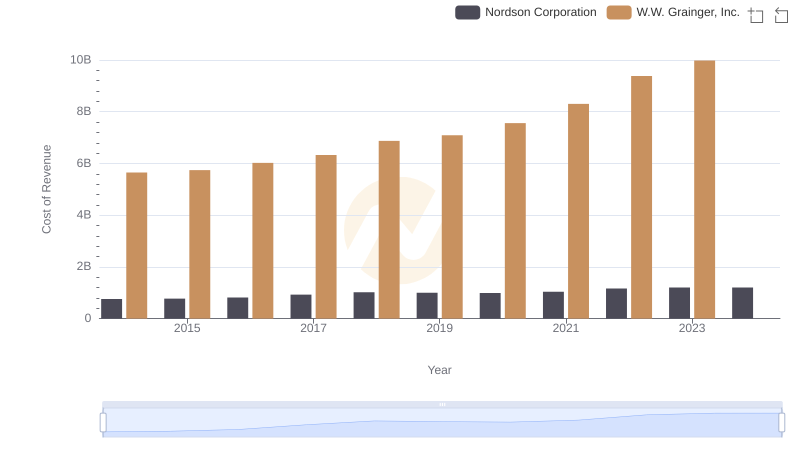
Cost of Revenue Comparison: W.W. Grainger, Inc. vs Nordson Corporation
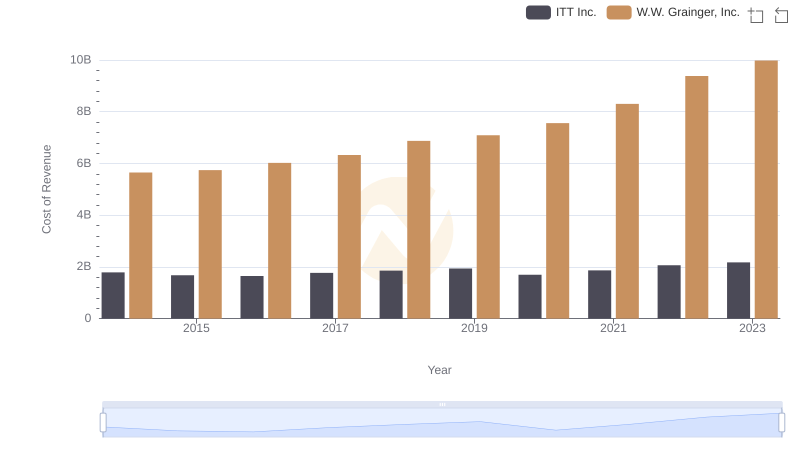
Cost of Revenue Comparison: W.W. Grainger, Inc. vs ITT Inc.
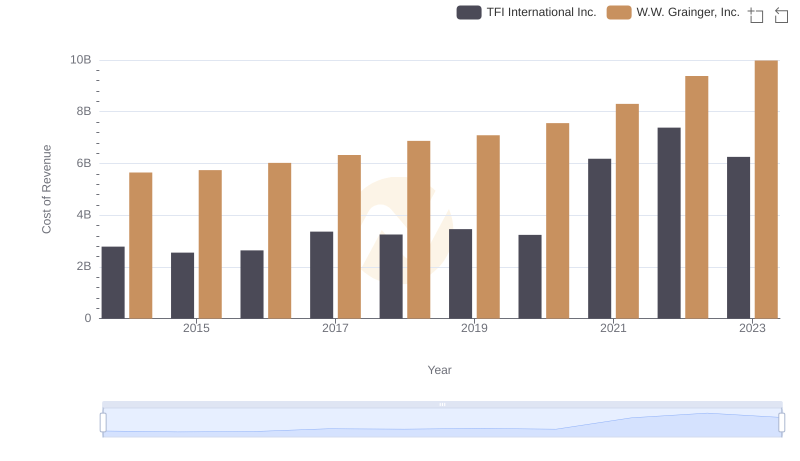
Cost of Revenue: Key Insights for W.W. Grainger, Inc. and TFI International Inc.
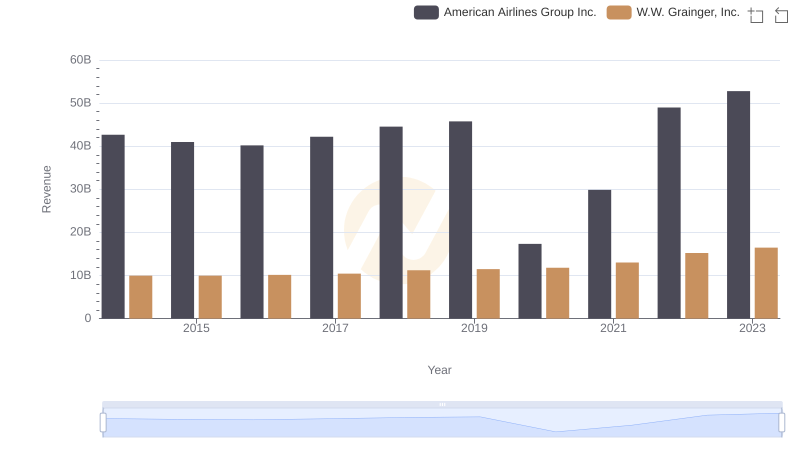
Comparing Revenue Performance: W.W. Grainger, Inc. or American Airlines Group Inc.?
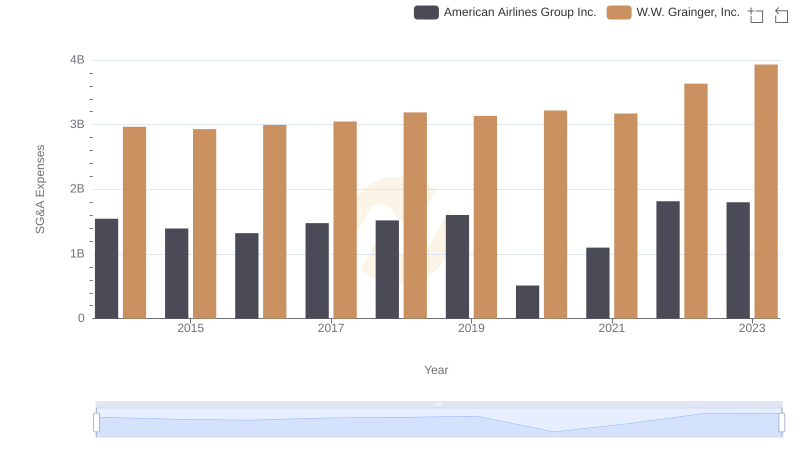
W.W. Grainger, Inc. or American Airlines Group Inc.: Who Manages SG&A Costs Better?