| __timestamp | Allegion plc | Westinghouse Air Brake Technologies Corporation |
|---|---|---|
| Wednesday, January 1, 2014 | 2118300000 | 3044454000 |
| Thursday, January 1, 2015 | 2068100000 | 3307998000 |
| Friday, January 1, 2016 | 2238000000 | 2931188000 |
| Sunday, January 1, 2017 | 2408200000 | 3881756000 |
| Monday, January 1, 2018 | 2731700000 | 4363547000 |
| Tuesday, January 1, 2019 | 2854000000 | 8200000000 |
| Wednesday, January 1, 2020 | 2719900000 | 7556100000 |
| Friday, January 1, 2021 | 2867400000 | 7822000000 |
| Saturday, January 1, 2022 | 3271900000 | 8362000000 |
| Sunday, January 1, 2023 | 3650800000 | 9677000000 |
| Monday, January 1, 2024 | 3772200000 | 10387000000 |
Unleashing insights
In the competitive landscape of industrial technology, Westinghouse Air Brake Technologies Corporation and Allegion plc have showcased remarkable revenue trajectories over the past decade. From 2014 to 2023, Westinghouse Air Brake Technologies Corporation consistently outperformed Allegion plc, with revenues peaking at approximately $9.7 billion in 2023, marking a staggering 218% increase from 2014. Allegion plc, while trailing, demonstrated steady growth, achieving a 72% increase in revenue over the same period, reaching around $3.7 billion in 2023.
These trends highlight the dynamic nature of the industrial sector, where strategic decisions and market conditions play pivotal roles in shaping financial outcomes.
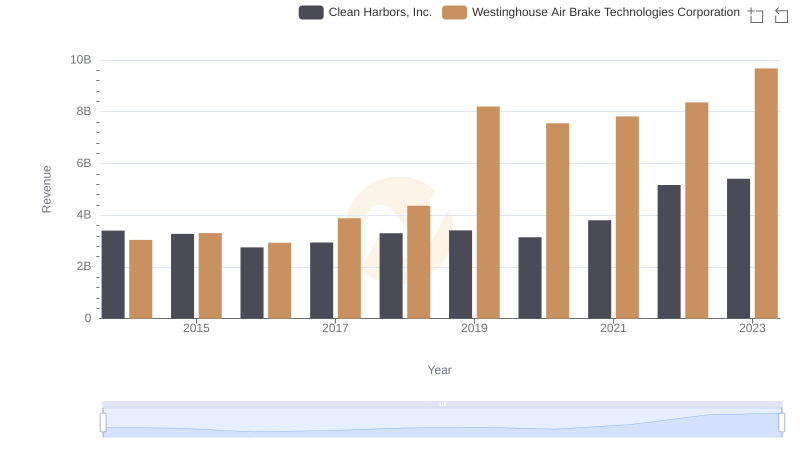
Annual Revenue Comparison: Westinghouse Air Brake Technologies Corporation vs Clean Harbors, Inc.
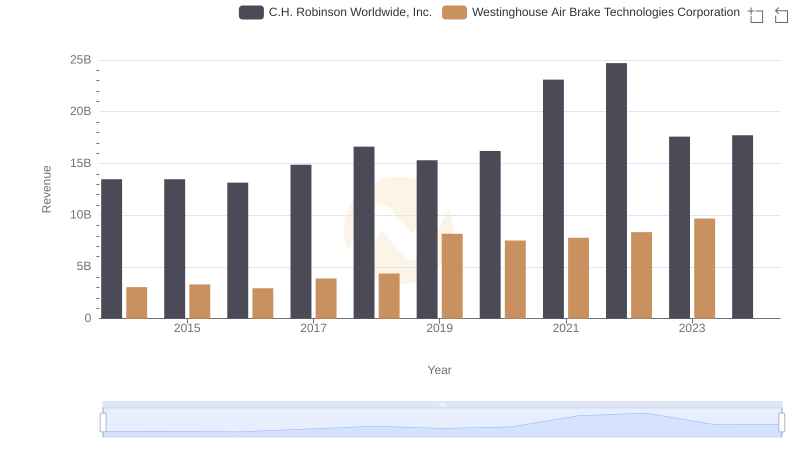
Breaking Down Revenue Trends: Westinghouse Air Brake Technologies Corporation vs C.H. Robinson Worldwide, Inc.
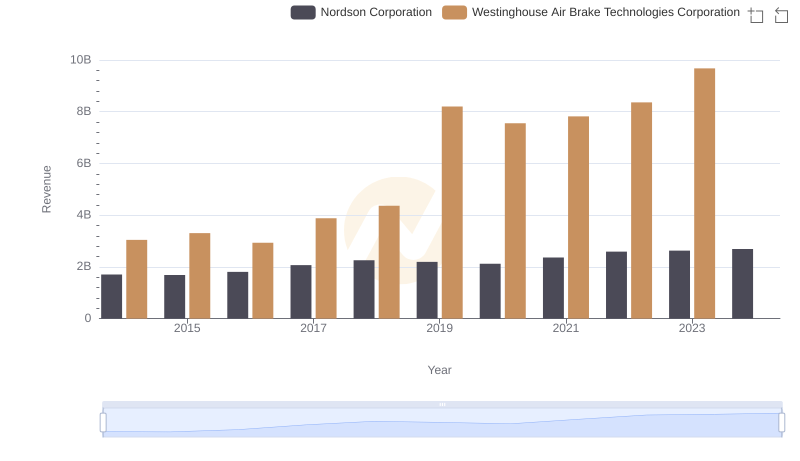
Annual Revenue Comparison: Westinghouse Air Brake Technologies Corporation vs Nordson Corporation
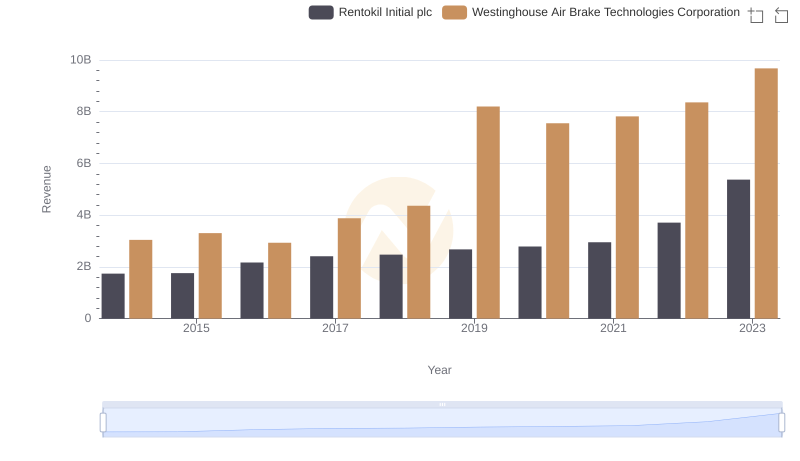
Revenue Insights: Westinghouse Air Brake Technologies Corporation and Rentokil Initial plc Performance Compared
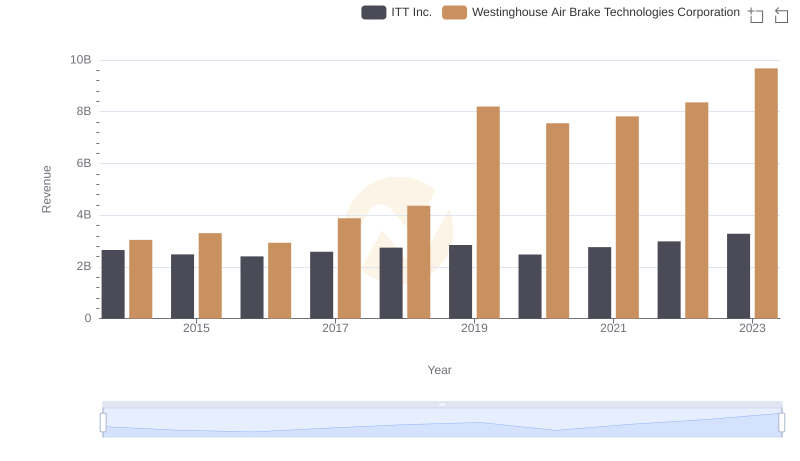
Westinghouse Air Brake Technologies Corporation vs ITT Inc.: Annual Revenue Growth Compared
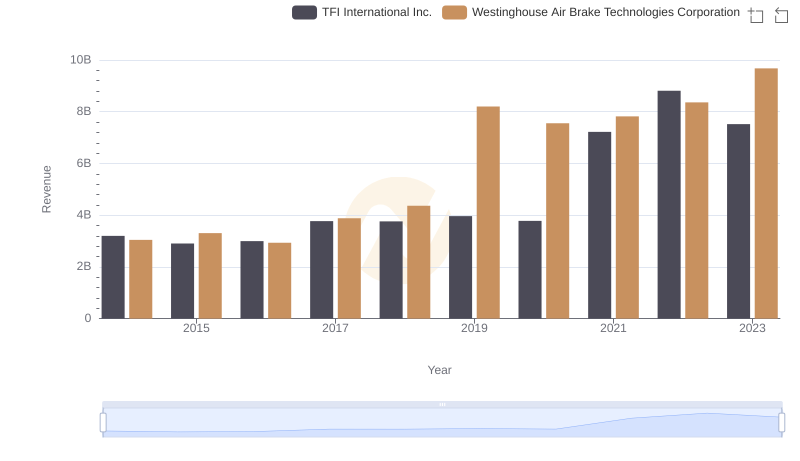
Westinghouse Air Brake Technologies Corporation or TFI International Inc.: Who Leads in Yearly Revenue?
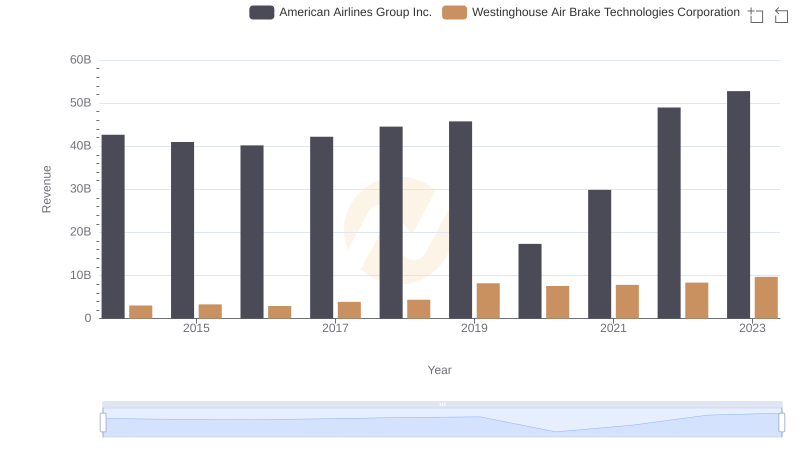
Westinghouse Air Brake Technologies Corporation vs American Airlines Group Inc.: Annual Revenue Growth Compared
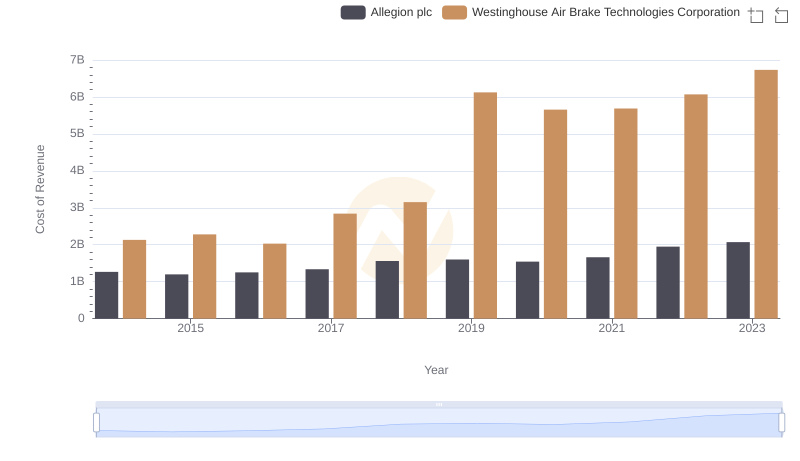
Comparing Cost of Revenue Efficiency: Westinghouse Air Brake Technologies Corporation vs Allegion plc
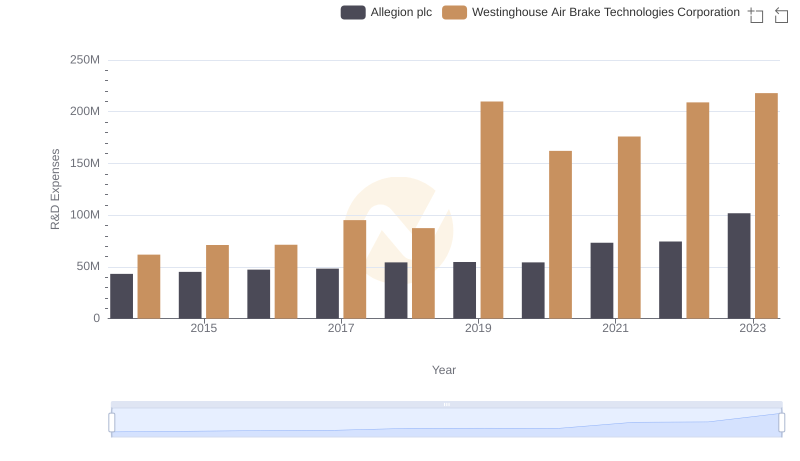
Research and Development Investment: Westinghouse Air Brake Technologies Corporation vs Allegion plc
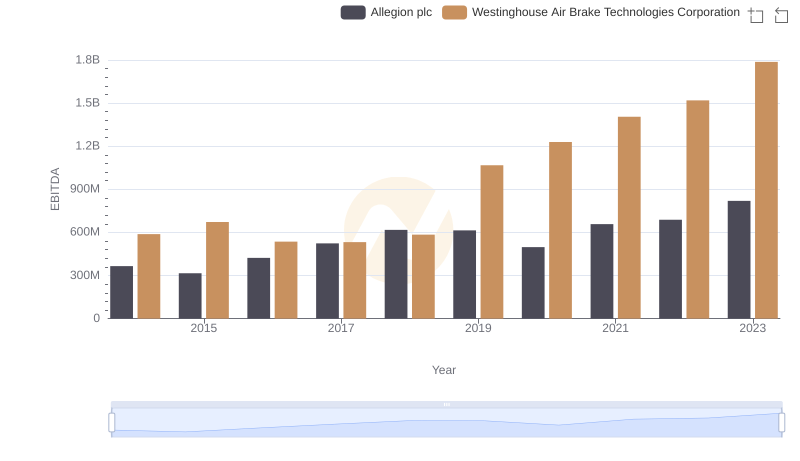
EBITDA Metrics Evaluated: Westinghouse Air Brake Technologies Corporation vs Allegion plc