| __timestamp | Graco Inc. | Watsco, Inc. |
|---|---|---|
| Wednesday, January 1, 2014 | 554394000 | 2988138000 |
| Thursday, January 1, 2015 | 601785000 | 3105882000 |
| Friday, January 1, 2016 | 621054000 | 3186118000 |
| Sunday, January 1, 2017 | 681695000 | 3276296000 |
| Monday, January 1, 2018 | 770753000 | 3426401000 |
| Tuesday, January 1, 2019 | 786289000 | 3613406000 |
| Wednesday, January 1, 2020 | 795178000 | 3832107000 |
| Friday, January 1, 2021 | 953659000 | 4612647000 |
| Saturday, January 1, 2022 | 1086082000 | 5244055000 |
| Sunday, January 1, 2023 | 1034585000 | 5291627000 |
| Monday, January 1, 2024 | 990855000 | 5573604000 |
Unleashing insights
In the competitive landscape of industrial manufacturing, understanding cost dynamics is crucial. Over the past decade, Watsco, Inc. and Graco Inc. have showcased intriguing trends in their cost of revenue. From 2014 to 2023, Watsco, Inc. experienced a steady increase, with costs rising by approximately 77%, peaking in 2023. This growth reflects their expanding market presence and operational scale. In contrast, Graco Inc. saw a 86% increase in costs from 2014 to 2022, before a slight dip in 2023. This fluctuation could indicate strategic shifts or market challenges. Notably, data for 2024 is incomplete, highlighting the need for ongoing analysis. These insights underscore the importance of cost management in sustaining profitability and competitiveness in the industrial sector.
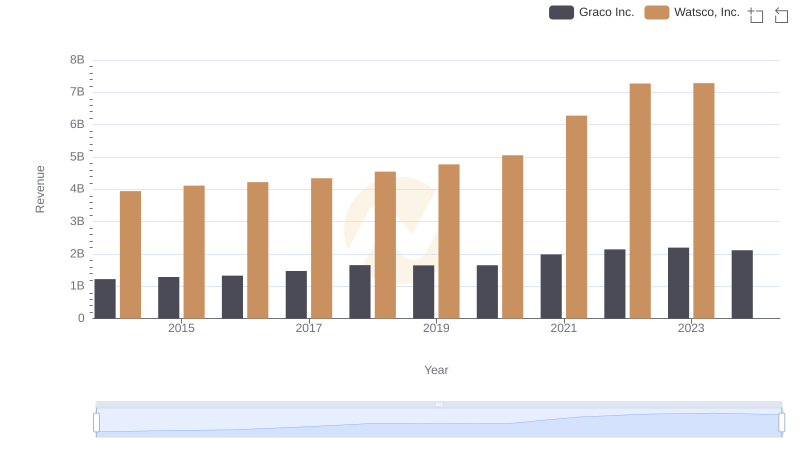
Watsco, Inc. or Graco Inc.: Who Leads in Yearly Revenue?
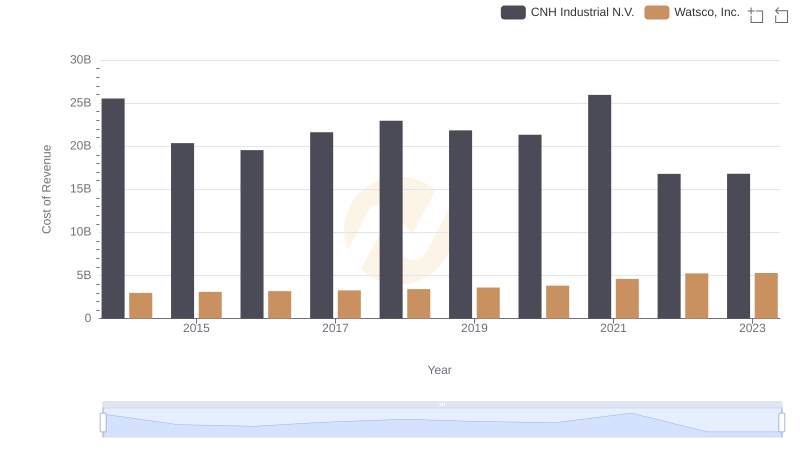
Watsco, Inc. vs CNH Industrial N.V.: Efficiency in Cost of Revenue Explored
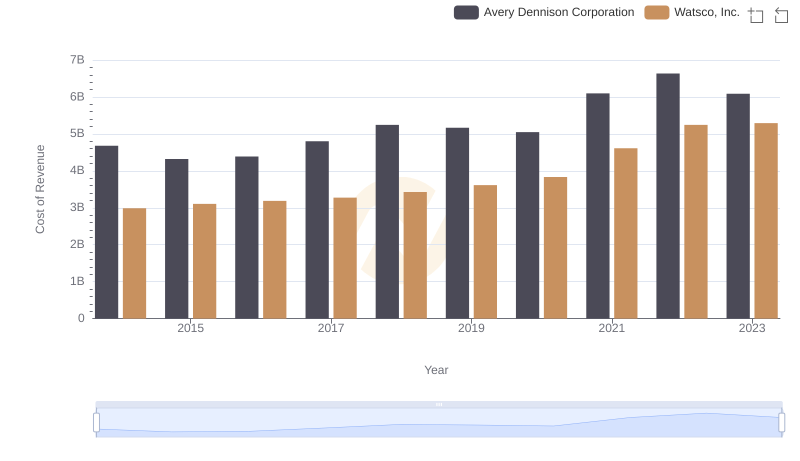
Cost of Revenue Comparison: Watsco, Inc. vs Avery Dennison Corporation
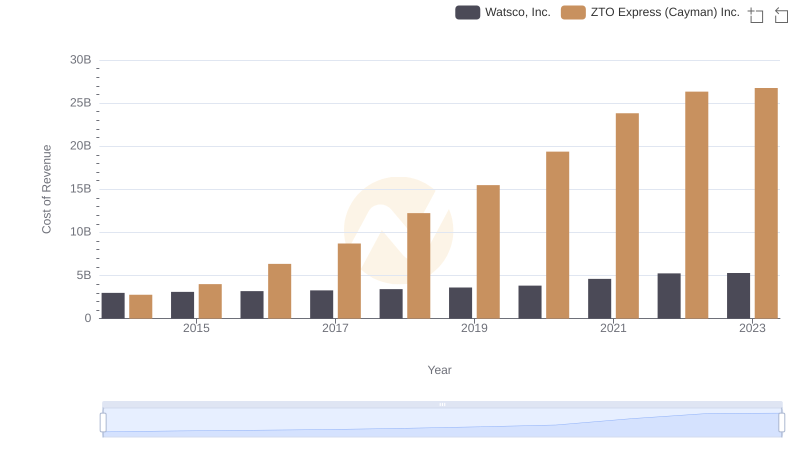
Watsco, Inc. vs ZTO Express (Cayman) Inc.: Efficiency in Cost of Revenue Explored
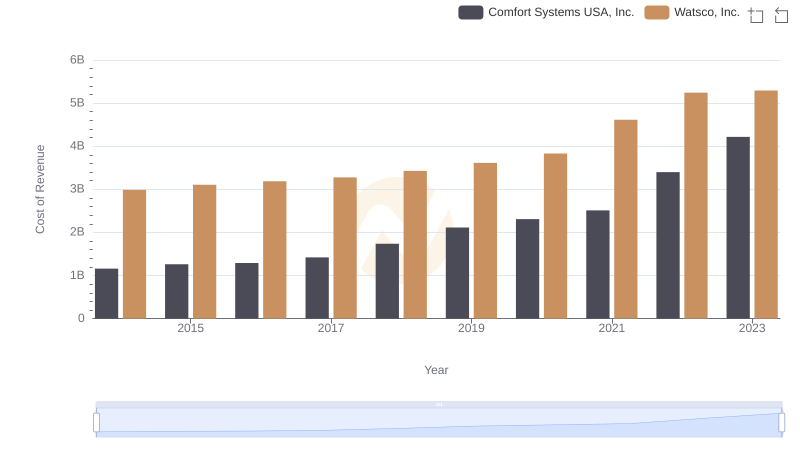
Cost Insights: Breaking Down Watsco, Inc. and Comfort Systems USA, Inc.'s Expenses
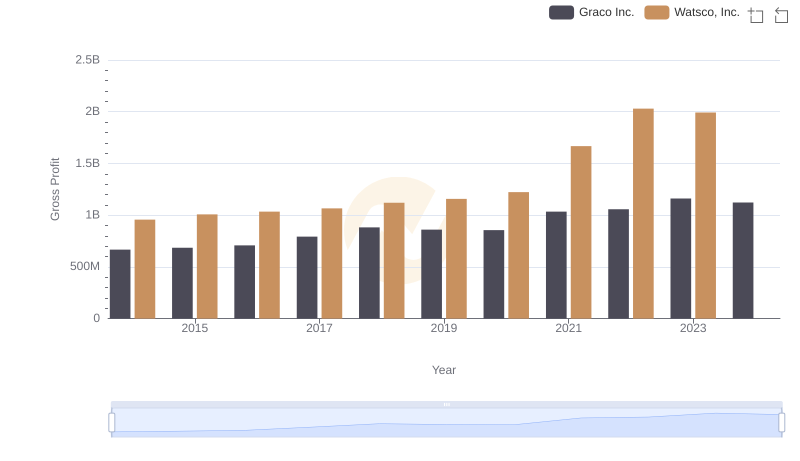
Who Generates Higher Gross Profit? Watsco, Inc. or Graco Inc.
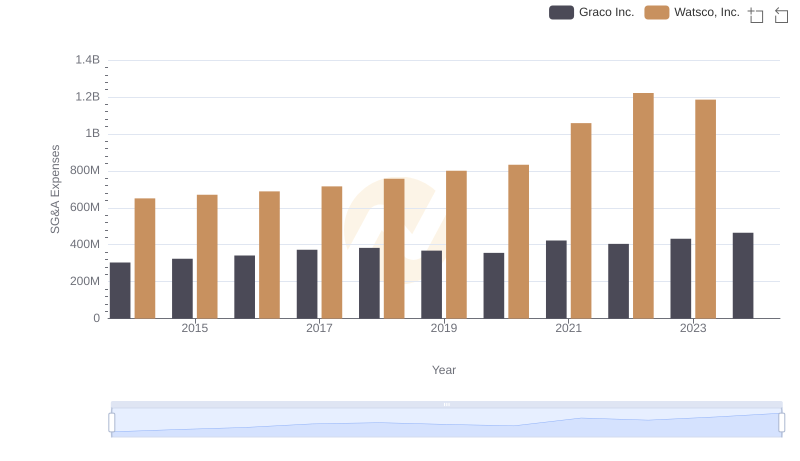
Watsco, Inc. or Graco Inc.: Who Manages SG&A Costs Better?
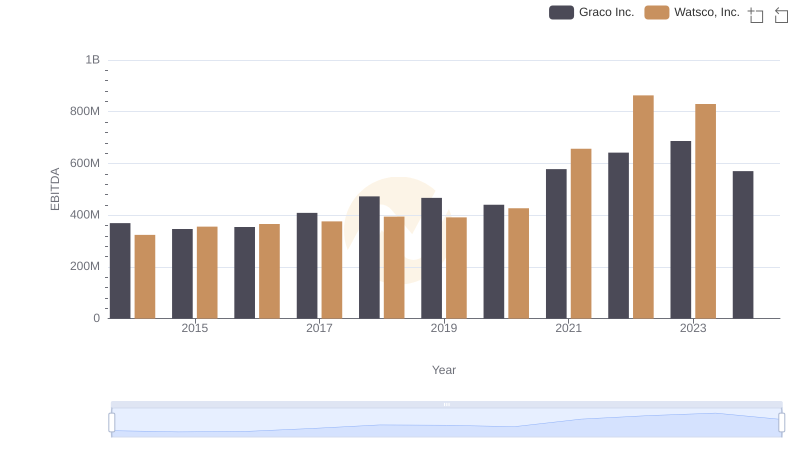
Watsco, Inc. vs Graco Inc.: In-Depth EBITDA Performance Comparison