| __timestamp | Textron Inc. | Waste Management, Inc. |
|---|---|---|
| Wednesday, January 1, 2014 | 13878000000 | 13996000000 |
| Thursday, January 1, 2015 | 13423000000 | 12961000000 |
| Friday, January 1, 2016 | 13788000000 | 13609000000 |
| Sunday, January 1, 2017 | 14198000000 | 14485000000 |
| Monday, January 1, 2018 | 13972000000 | 14914000000 |
| Tuesday, January 1, 2019 | 13630000000 | 15455000000 |
| Wednesday, January 1, 2020 | 11651000000 | 15218000000 |
| Friday, January 1, 2021 | 12382000000 | 17931000000 |
| Saturday, January 1, 2022 | 12869000000 | 19698000000 |
| Sunday, January 1, 2023 | 13683000000 | 20426000000 |
| Monday, January 1, 2024 | 13702000000 | 22063000000 |
Cracking the code
In the ever-evolving landscape of American industry, Waste Management, Inc. and Textron Inc. stand as titans in their respective fields. Over the past decade, these companies have showcased intriguing revenue trends, reflecting broader economic shifts. From 2014 to 2023, Waste Management, Inc. has consistently outpaced Textron Inc., with a notable 46% increase in revenue, peaking at approximately $20.4 billion in 2023. In contrast, Textron Inc. experienced a more modest growth of around 1.5% over the same period, with revenues stabilizing near $13.7 billion.
The data reveals a compelling narrative of resilience and adaptation. Waste Management's robust growth trajectory underscores its strategic expansions and operational efficiencies. Meanwhile, Textron's steady performance highlights its enduring presence in the aerospace and defense sectors. As we look to the future, these trends offer valuable insights into the dynamic interplay of industry forces shaping the American economic landscape.
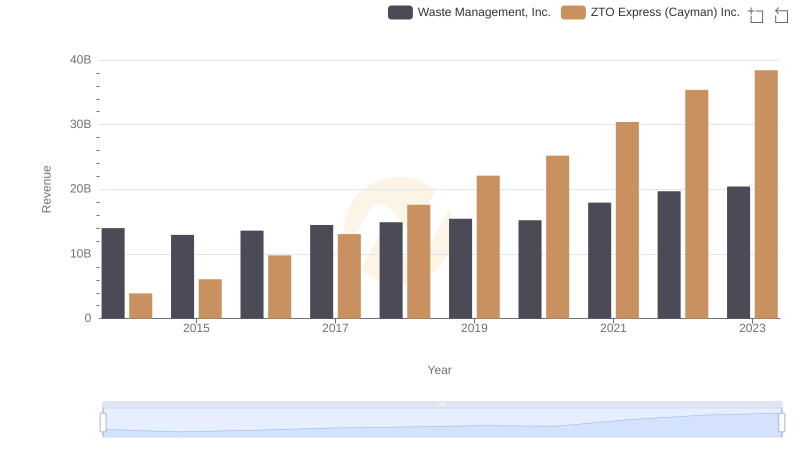
Revenue Insights: Waste Management, Inc. and ZTO Express (Cayman) Inc. Performance Compared
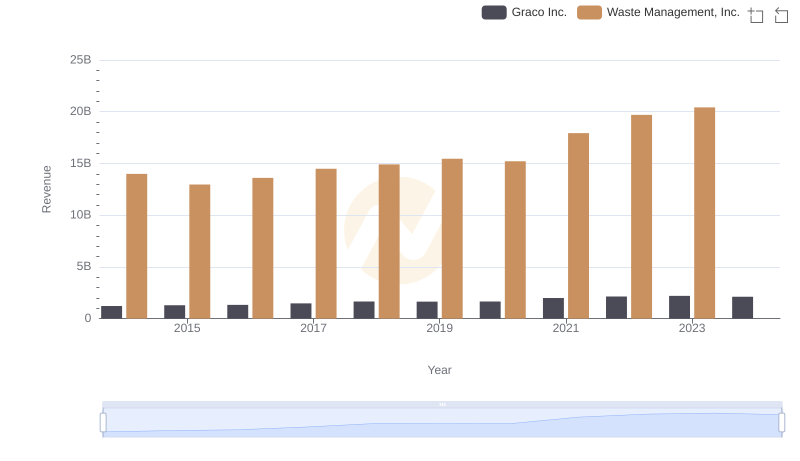
Annual Revenue Comparison: Waste Management, Inc. vs Graco Inc.
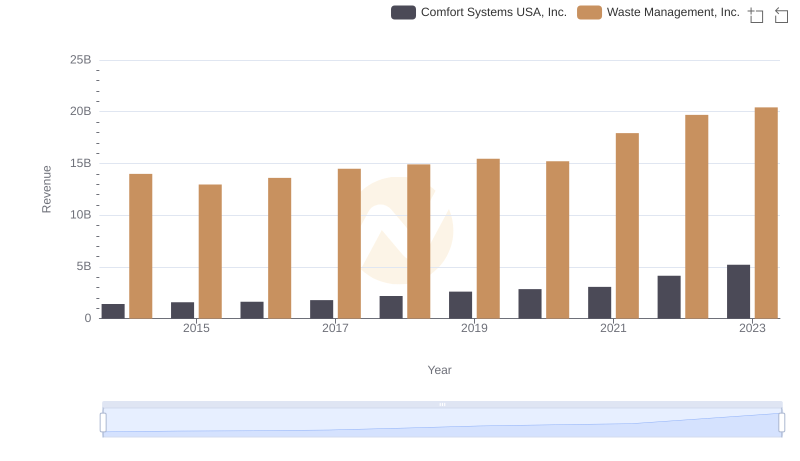
Revenue Insights: Waste Management, Inc. and Comfort Systems USA, Inc. Performance Compared
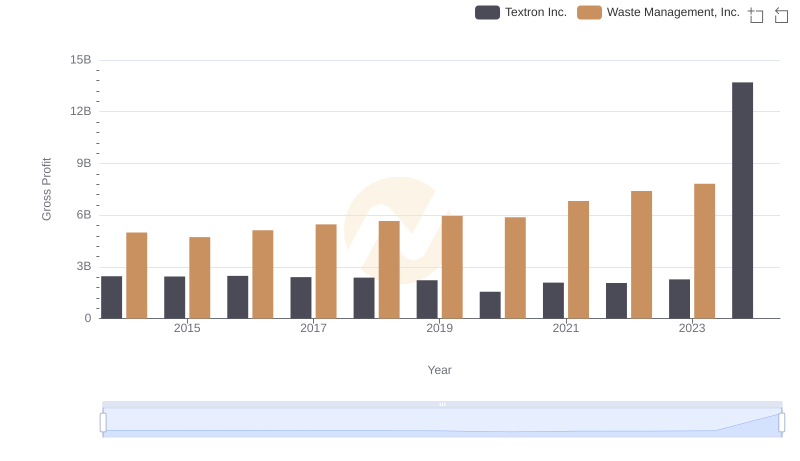
Waste Management, Inc. and Textron Inc.: A Detailed Gross Profit Analysis
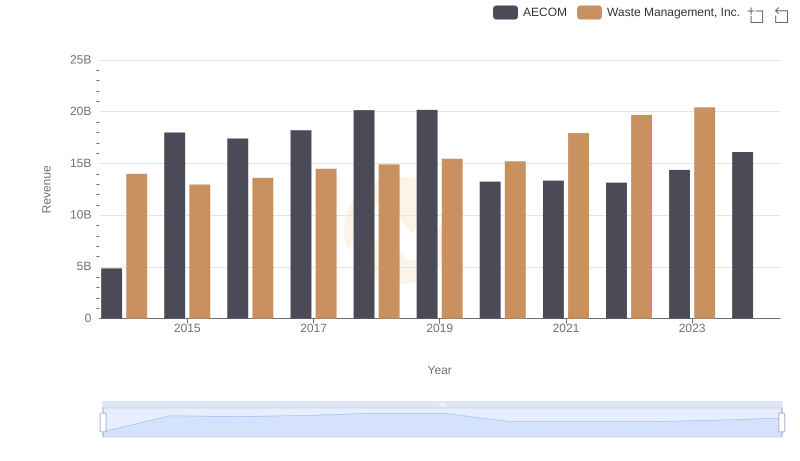
Waste Management, Inc. and AECOM: A Comprehensive Revenue Analysis
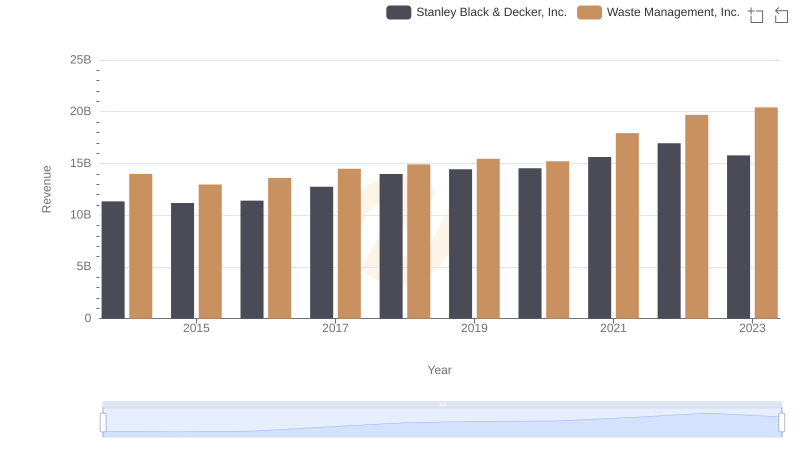
Breaking Down Revenue Trends: Waste Management, Inc. vs Stanley Black & Decker, Inc.
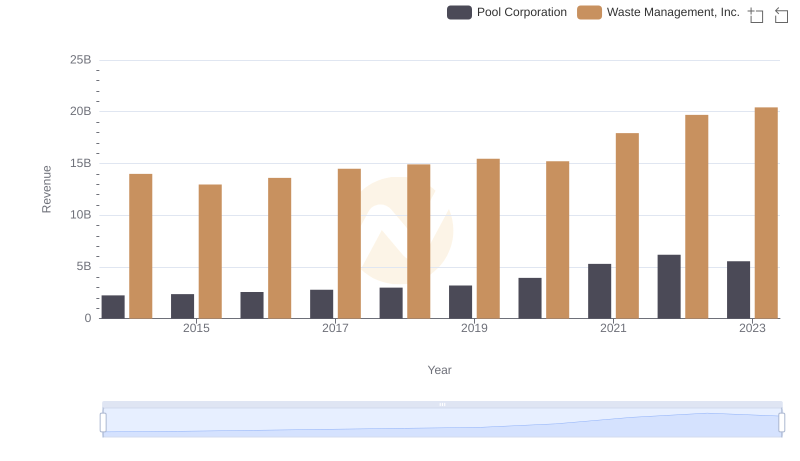
Annual Revenue Comparison: Waste Management, Inc. vs Pool Corporation
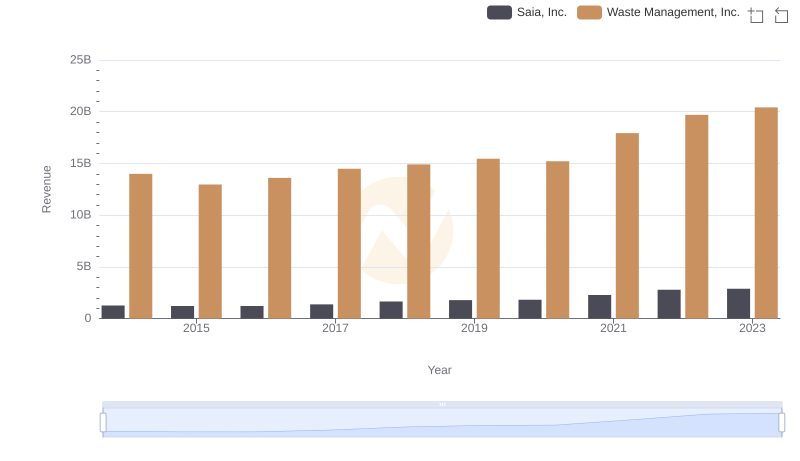
Waste Management, Inc. or Saia, Inc.: Who Leads in Yearly Revenue?
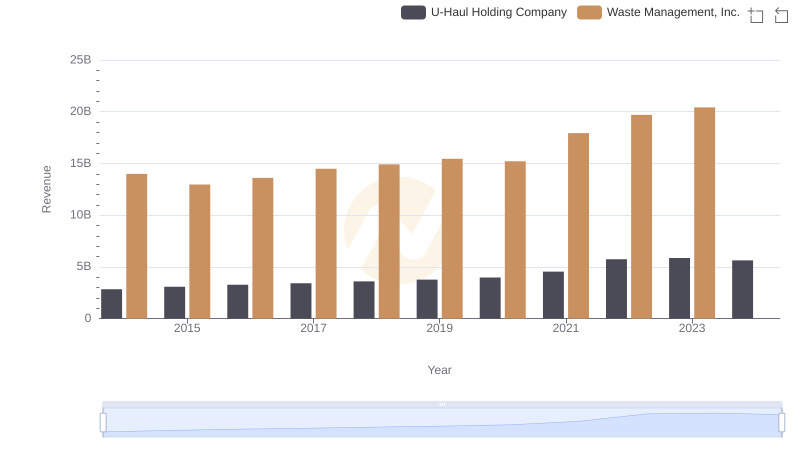
Waste Management, Inc. vs U-Haul Holding Company: Annual Revenue Growth Compared
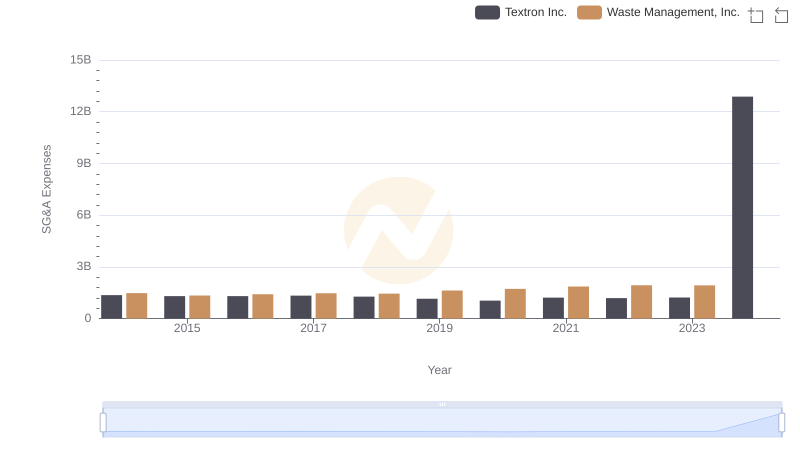
Waste Management, Inc. vs Textron Inc.: SG&A Expense Trends
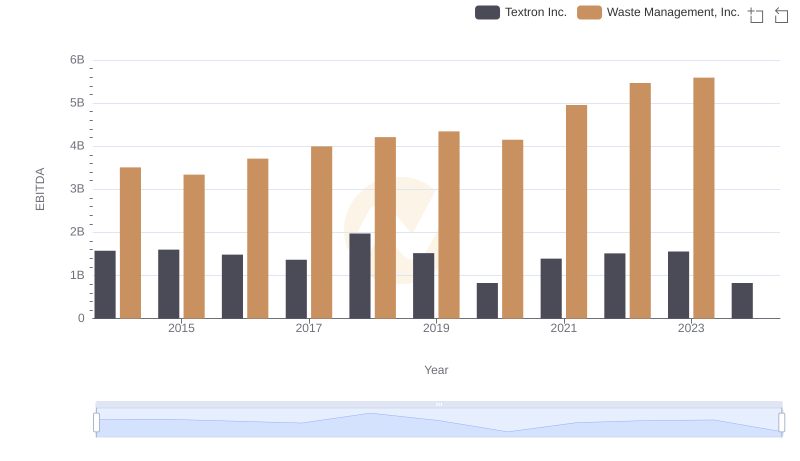
Professional EBITDA Benchmarking: Waste Management, Inc. vs Textron Inc.