| __timestamp | Comfort Systems USA, Inc. | Waste Management, Inc. |
|---|---|---|
| Wednesday, January 1, 2014 | 1410795000 | 13996000000 |
| Thursday, January 1, 2015 | 1580519000 | 12961000000 |
| Friday, January 1, 2016 | 1634340000 | 13609000000 |
| Sunday, January 1, 2017 | 1787922000 | 14485000000 |
| Monday, January 1, 2018 | 2182879000 | 14914000000 |
| Tuesday, January 1, 2019 | 2615277000 | 15455000000 |
| Wednesday, January 1, 2020 | 2856659000 | 15218000000 |
| Friday, January 1, 2021 | 3073636000 | 17931000000 |
| Saturday, January 1, 2022 | 4140364000 | 19698000000 |
| Sunday, January 1, 2023 | 5206760000 | 20426000000 |
| Monday, January 1, 2024 | 22063000000 |
Unveiling the hidden dimensions of data
In the competitive landscape of waste management and building services, Waste Management, Inc. and Comfort Systems USA, Inc. have shown remarkable revenue trajectories over the past decade. Since 2014, Waste Management, Inc. has consistently outperformed, with revenues peaking at approximately $20.4 billion in 2023, marking a 46% increase from 2014. Meanwhile, Comfort Systems USA, Inc. has demonstrated impressive growth, with revenues surging by 269% to reach around $5.2 billion in the same period.
The data reveals a steady upward trend for both companies, with Waste Management, Inc. maintaining a dominant position in the industry. Comfort Systems USA, Inc., however, showcases a more dynamic growth pattern, reflecting its expanding footprint in the building services sector. This comparison highlights the diverse strategies and market dynamics that drive success in these industries.

Waste Management, Inc. vs Textron Inc.: Examining Key Revenue Metrics
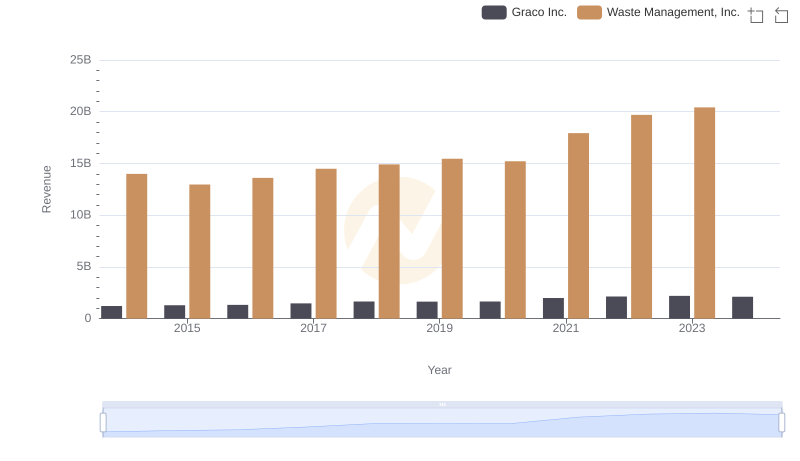
Annual Revenue Comparison: Waste Management, Inc. vs Graco Inc.
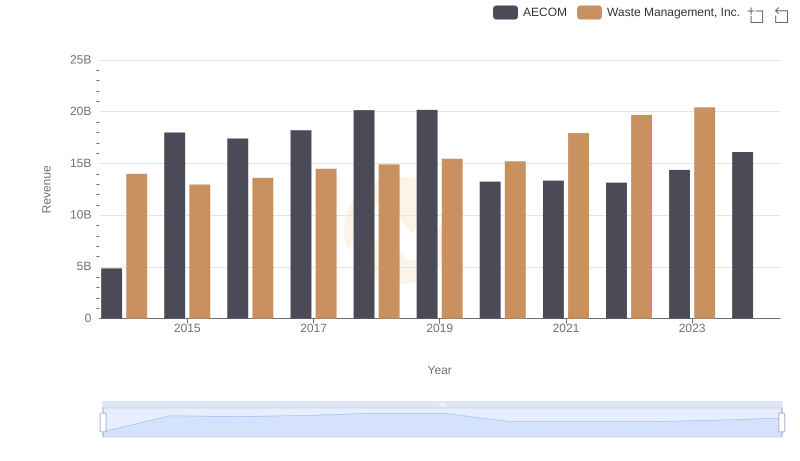
Waste Management, Inc. and AECOM: A Comprehensive Revenue Analysis
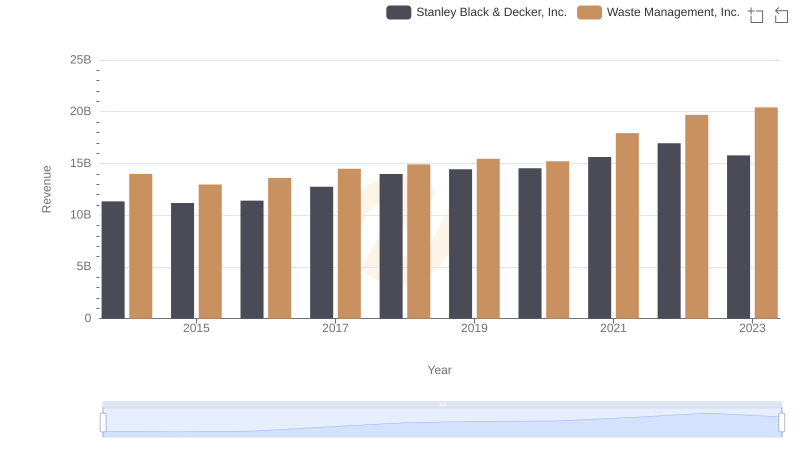
Breaking Down Revenue Trends: Waste Management, Inc. vs Stanley Black & Decker, Inc.
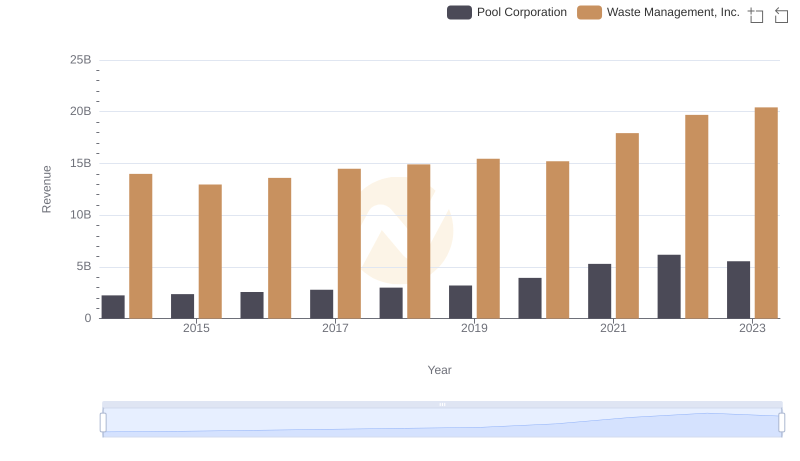
Annual Revenue Comparison: Waste Management, Inc. vs Pool Corporation
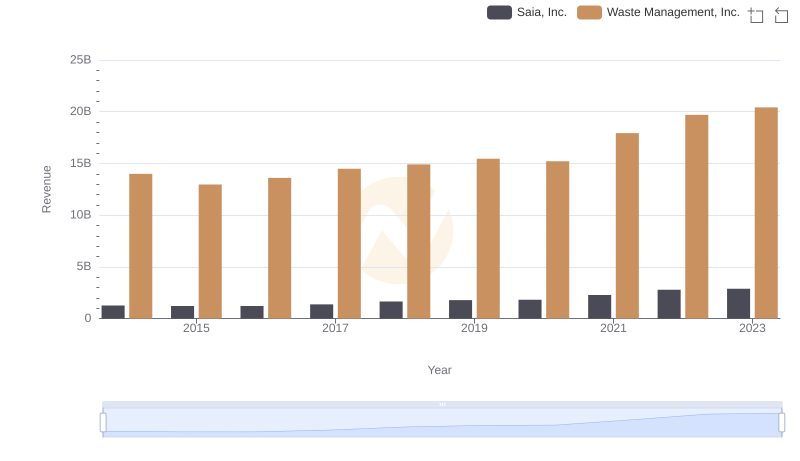
Waste Management, Inc. or Saia, Inc.: Who Leads in Yearly Revenue?
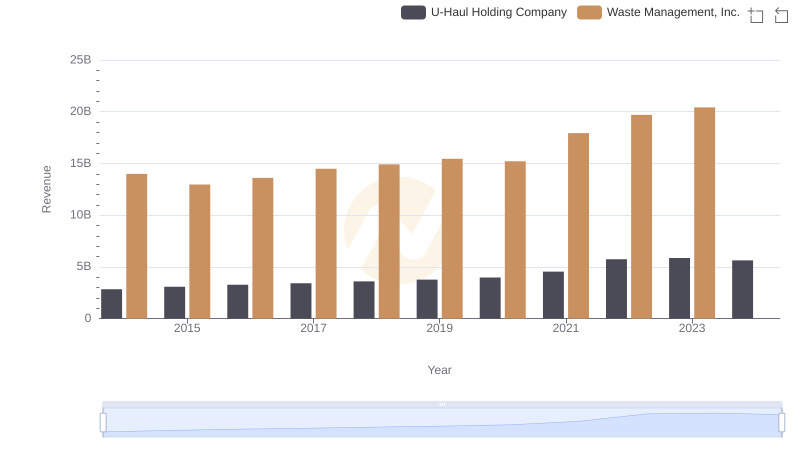
Waste Management, Inc. vs U-Haul Holding Company: Annual Revenue Growth Compared
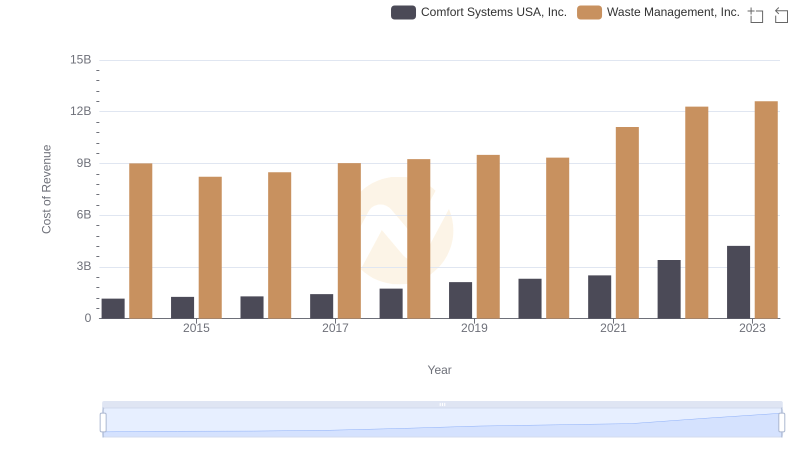
Cost of Revenue Comparison: Waste Management, Inc. vs Comfort Systems USA, Inc.
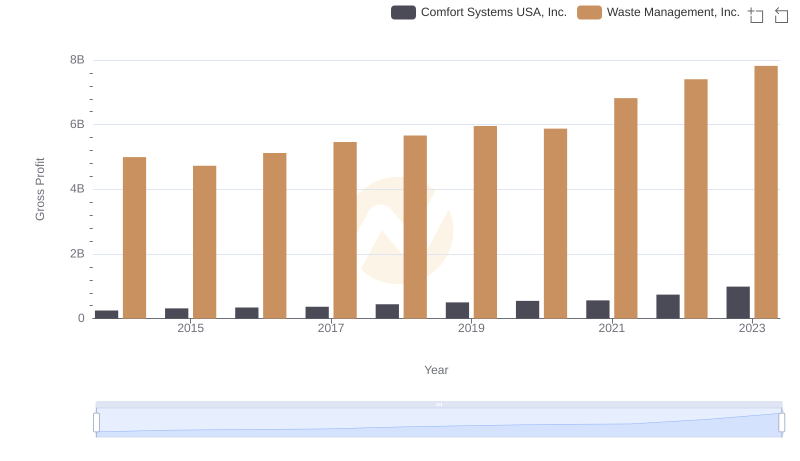
Who Generates Higher Gross Profit? Waste Management, Inc. or Comfort Systems USA, Inc.
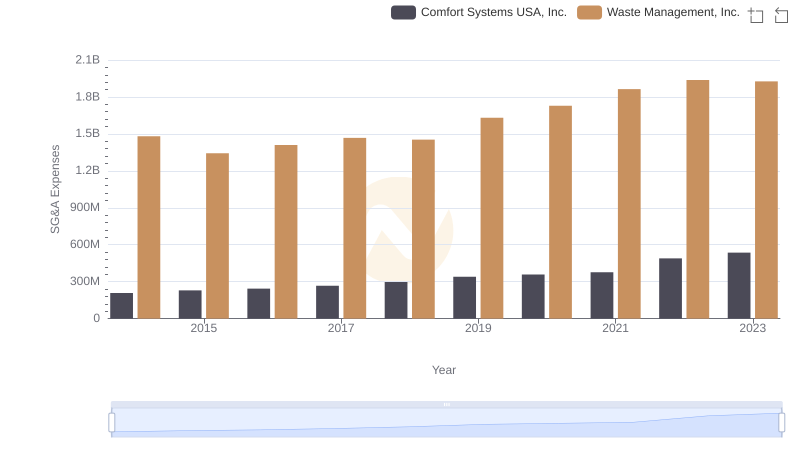
Waste Management, Inc. vs Comfort Systems USA, Inc.: SG&A Expense Trends