| __timestamp | Graco Inc. | Waste Management, Inc. |
|---|---|---|
| Wednesday, January 1, 2014 | 1221130000 | 13996000000 |
| Thursday, January 1, 2015 | 1286485000 | 12961000000 |
| Friday, January 1, 2016 | 1329293000 | 13609000000 |
| Sunday, January 1, 2017 | 1474744000 | 14485000000 |
| Monday, January 1, 2018 | 1653292000 | 14914000000 |
| Tuesday, January 1, 2019 | 1646045000 | 15455000000 |
| Wednesday, January 1, 2020 | 1650115000 | 15218000000 |
| Friday, January 1, 2021 | 1987608000 | 17931000000 |
| Saturday, January 1, 2022 | 2143521000 | 19698000000 |
| Sunday, January 1, 2023 | 2195606000 | 20426000000 |
| Monday, January 1, 2024 | 2113316000 | 22063000000 |
Data in motion
In the ever-evolving landscape of industrial giants, Waste Management, Inc. and Graco Inc. have carved distinct paths over the past decade. Waste Management, Inc., a leader in environmental services, has consistently outpaced Graco Inc., a stalwart in fluid handling systems, in terms of annual revenue. From 2014 to 2023, Waste Management's revenue surged by approximately 46%, peaking at over $20 billion in 2023. In contrast, Graco Inc. experienced a robust 80% growth, reaching over $2 billion in the same period.
Despite the impressive growth, 2024 data for Waste Management remains elusive, leaving room for speculation. This comparison not only highlights the resilience of these companies but also underscores the dynamic nature of their respective industries. As we look to the future, the question remains: how will these titans adapt to the challenges and opportunities that lie ahead?
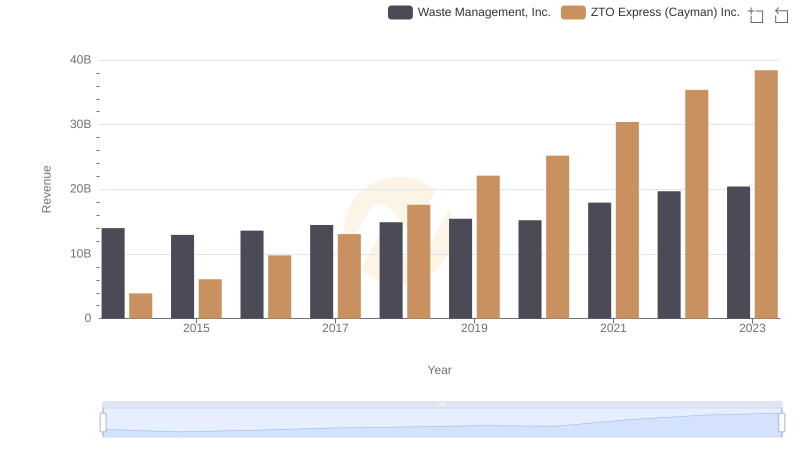
Revenue Insights: Waste Management, Inc. and ZTO Express (Cayman) Inc. Performance Compared

Waste Management, Inc. vs Textron Inc.: Examining Key Revenue Metrics
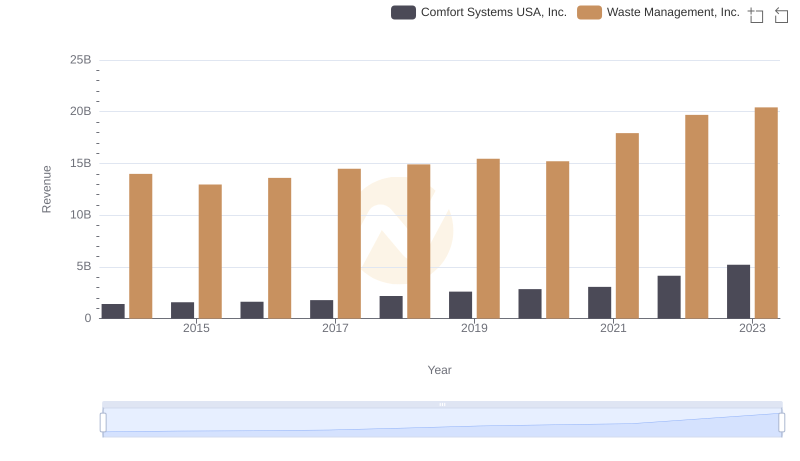
Revenue Insights: Waste Management, Inc. and Comfort Systems USA, Inc. Performance Compared
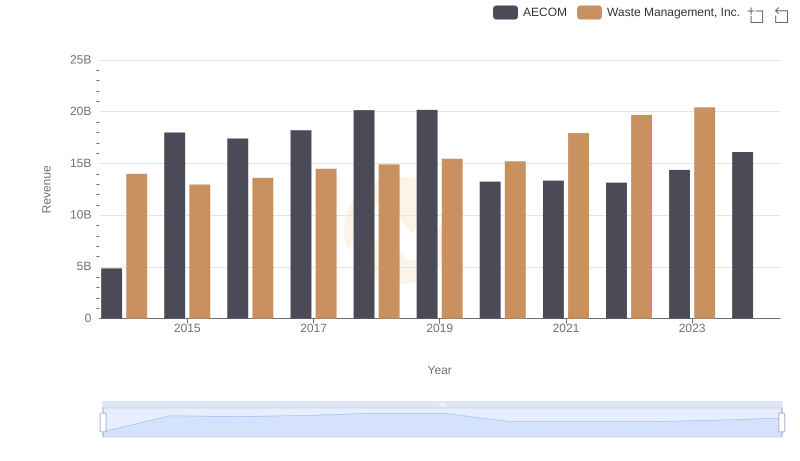
Waste Management, Inc. and AECOM: A Comprehensive Revenue Analysis
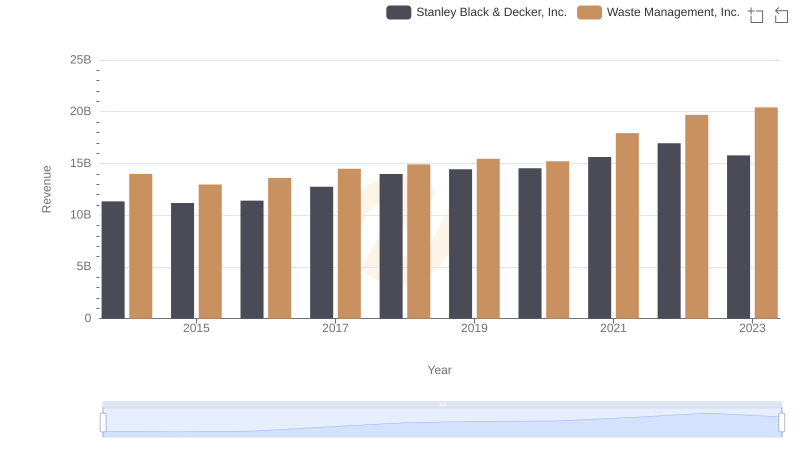
Breaking Down Revenue Trends: Waste Management, Inc. vs Stanley Black & Decker, Inc.
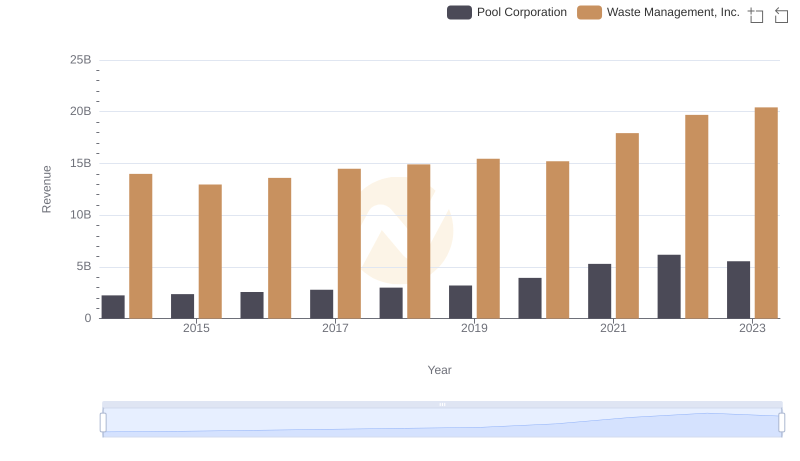
Annual Revenue Comparison: Waste Management, Inc. vs Pool Corporation
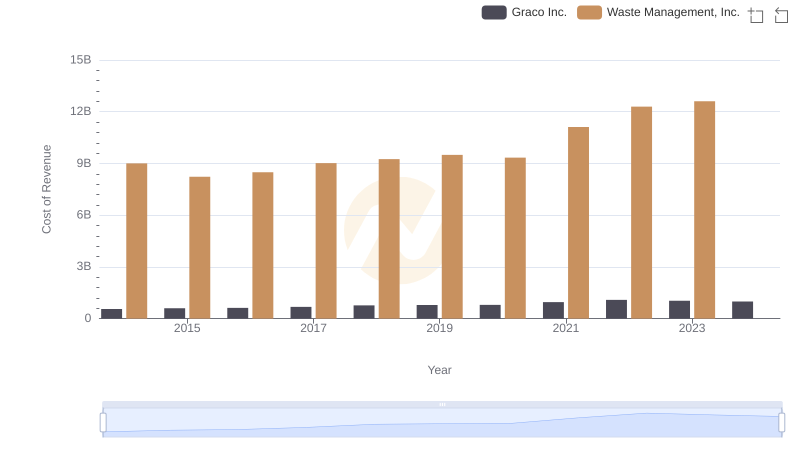
Cost Insights: Breaking Down Waste Management, Inc. and Graco Inc.'s Expenses
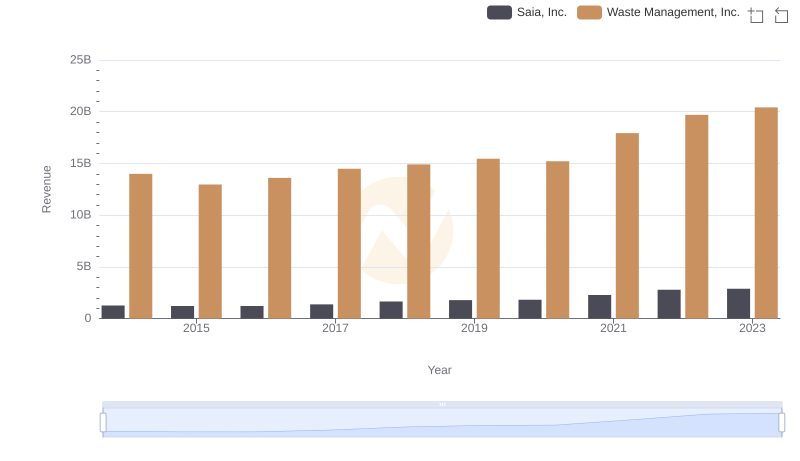
Waste Management, Inc. or Saia, Inc.: Who Leads in Yearly Revenue?
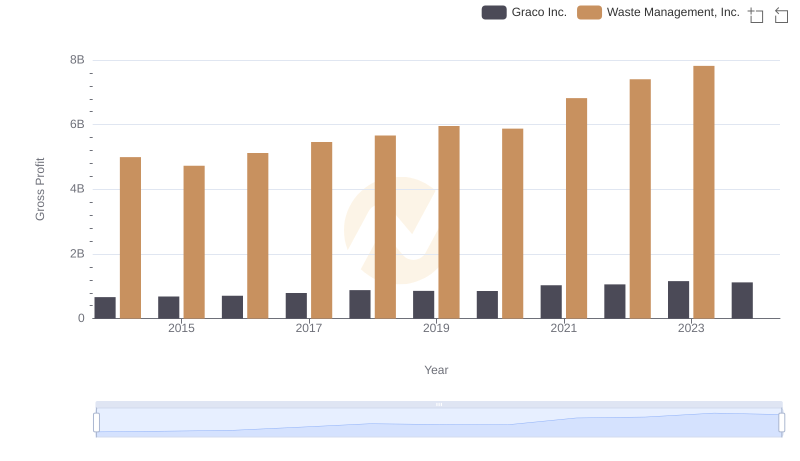
Gross Profit Analysis: Comparing Waste Management, Inc. and Graco Inc.

Waste Management, Inc. and Graco Inc.: A Detailed Examination of EBITDA Performance