| __timestamp | TransUnion | Union Pacific Corporation |
|---|---|---|
| Wednesday, January 1, 2014 | 1304700000 | 23988000000 |
| Thursday, January 1, 2015 | 1506800000 | 21813000000 |
| Friday, January 1, 2016 | 1704900000 | 19941000000 |
| Sunday, January 1, 2017 | 1933800000 | 21240000000 |
| Monday, January 1, 2018 | 2317200000 | 22832000000 |
| Tuesday, January 1, 2019 | 2656100000 | 21708000000 |
| Wednesday, January 1, 2020 | 2716600000 | 19533000000 |
| Friday, January 1, 2021 | 2960200000 | 21804000000 |
| Saturday, January 1, 2022 | 3709900000 | 24875000000 |
| Sunday, January 1, 2023 | 3831200000 | 24119000000 |
| Monday, January 1, 2024 | 4183800000 | 24250000000 |
Unveiling the hidden dimensions of data
In the world of business, revenue is a key indicator of a company's success and market position. This chart provides a fascinating comparison of revenue generation between Union Pacific Corporation and TransUnion from 2014 to 2023. Union Pacific, a titan in the transportation industry, consistently outpaces TransUnion, a leader in credit reporting, by a significant margin. For instance, in 2022, Union Pacific's revenue was approximately 6.7 times that of TransUnion. Over the years, Union Pacific's revenue has shown a steady upward trend, peaking in 2022 with a 27% increase from 2014. Meanwhile, TransUnion has also experienced growth, with its revenue nearly tripling over the same period. However, the data for 2024 is incomplete, leaving room for speculation on future trends. This comparison highlights the diverse revenue landscapes of these two industry giants, offering insights into their financial trajectories.

Union Pacific Corporation vs Watsco, Inc.: Examining Key Revenue Metrics
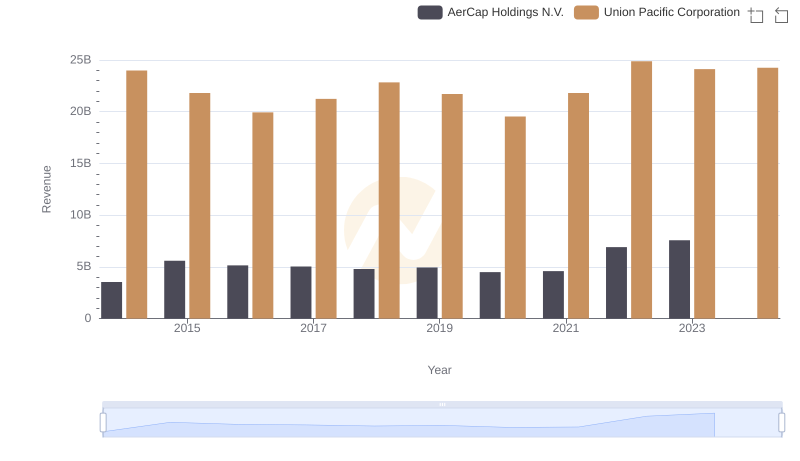
Union Pacific Corporation or AerCap Holdings N.V.: Who Leads in Yearly Revenue?
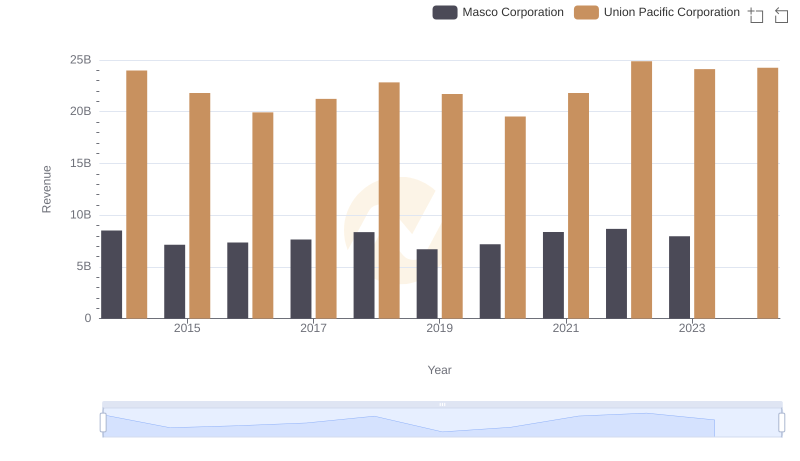
Annual Revenue Comparison: Union Pacific Corporation vs Masco Corporation
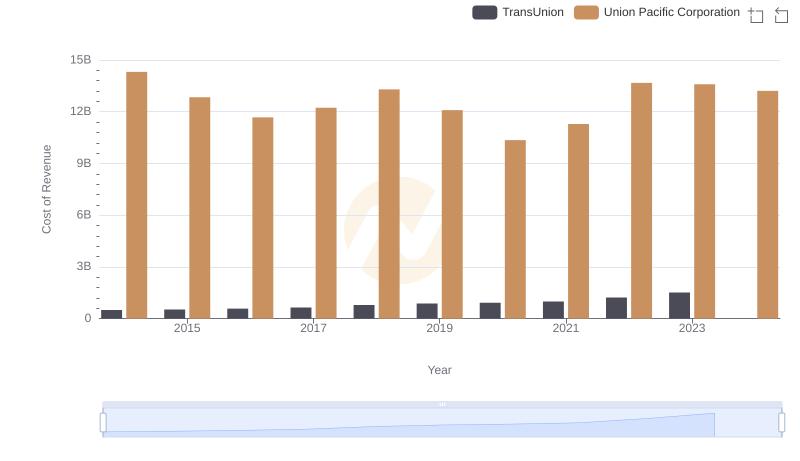
Union Pacific Corporation vs TransUnion: Efficiency in Cost of Revenue Explored
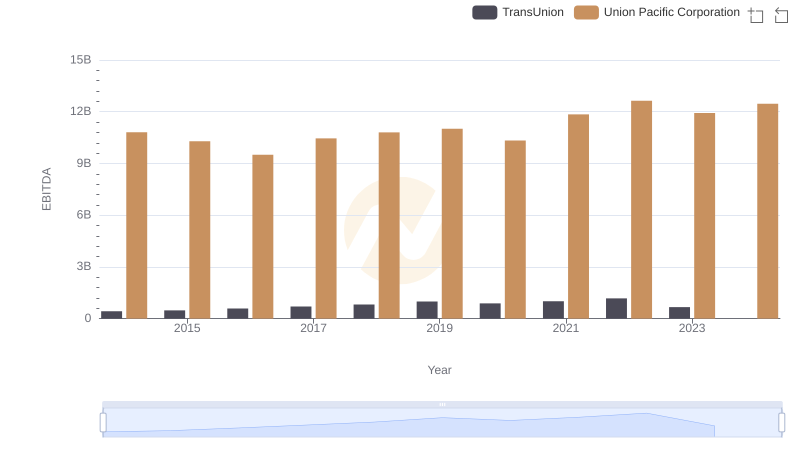
EBITDA Analysis: Evaluating Union Pacific Corporation Against TransUnion