| __timestamp | Pentair plc | Union Pacific Corporation |
|---|---|---|
| Wednesday, January 1, 2014 | 7039000000 | 23988000000 |
| Thursday, January 1, 2015 | 6449000000 | 21813000000 |
| Friday, January 1, 2016 | 4890000000 | 19941000000 |
| Sunday, January 1, 2017 | 4936500000 | 21240000000 |
| Monday, January 1, 2018 | 2965100000 | 22832000000 |
| Tuesday, January 1, 2019 | 2957200000 | 21708000000 |
| Wednesday, January 1, 2020 | 3017800000 | 19533000000 |
| Friday, January 1, 2021 | 3764800000 | 21804000000 |
| Saturday, January 1, 2022 | 4121800000 | 24875000000 |
| Sunday, January 1, 2023 | 4104500000 | 24119000000 |
| Monday, January 1, 2024 | 4082800000 | 24250000000 |
Unleashing insights
In the ever-evolving landscape of American industry, Union Pacific Corporation and Pentair plc stand as titans in their respective fields. Over the past decade, Union Pacific has consistently demonstrated its dominance, with revenue figures peaking at approximately $24.9 billion in 2022, marking a 27% increase from 2016. Meanwhile, Pentair plc, a leader in water solutions, experienced a revenue high of around $7 billion in 2014, but faced a decline, stabilizing at about $4.1 billion in 2023.
As we look to the future, these companies' strategies will be pivotal in shaping their financial landscapes.
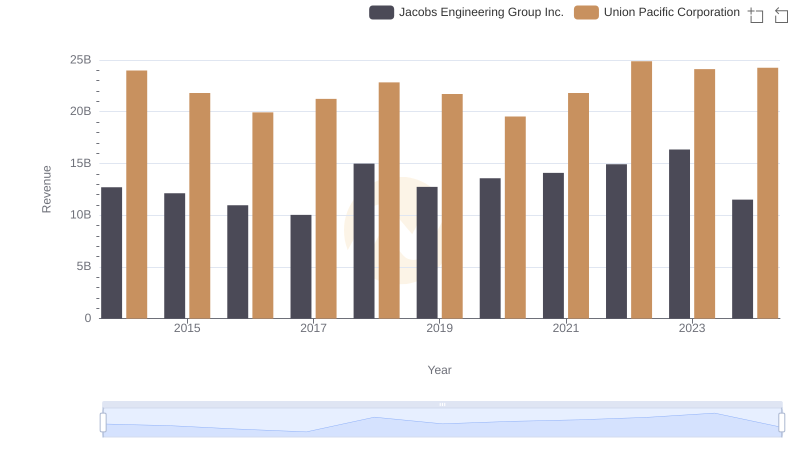
Comparing Revenue Performance: Union Pacific Corporation or Jacobs Engineering Group Inc.?
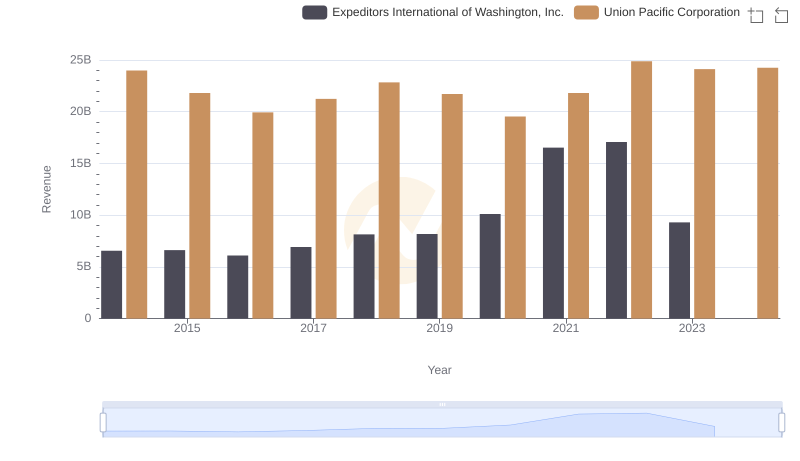
Revenue Insights: Union Pacific Corporation and Expeditors International of Washington, Inc. Performance Compared
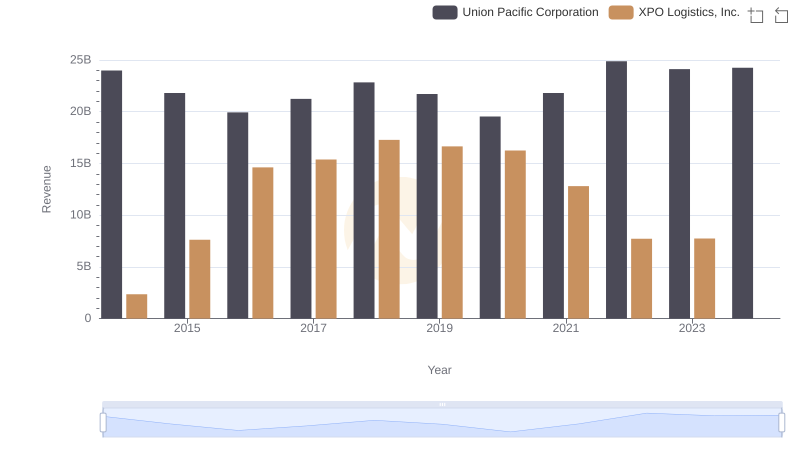
Annual Revenue Comparison: Union Pacific Corporation vs XPO Logistics, Inc.
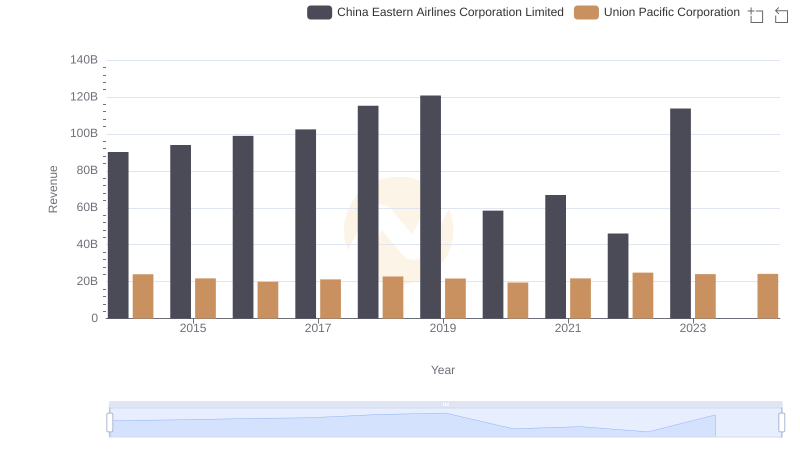
Comparing Revenue Performance: Union Pacific Corporation or China Eastern Airlines Corporation Limited?
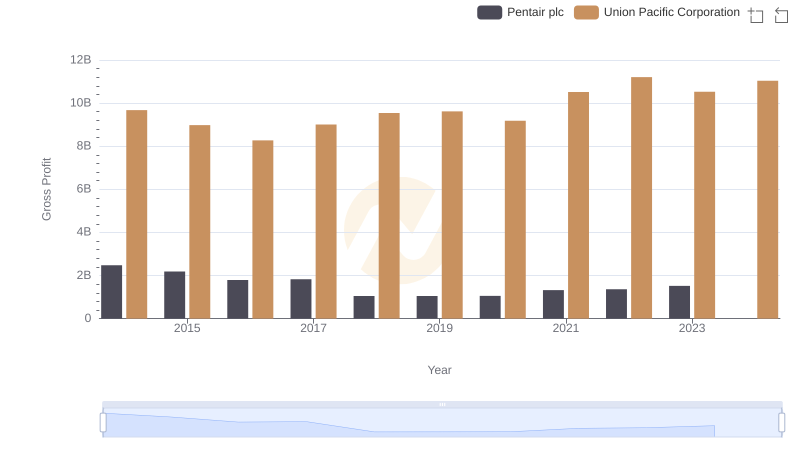
Key Insights on Gross Profit: Union Pacific Corporation vs Pentair plc