| __timestamp | Expeditors International of Washington, Inc. | Union Pacific Corporation |
|---|---|---|
| Wednesday, January 1, 2014 | 6564721000 | 23988000000 |
| Thursday, January 1, 2015 | 6616632000 | 21813000000 |
| Friday, January 1, 2016 | 6098037000 | 19941000000 |
| Sunday, January 1, 2017 | 6920948000 | 21240000000 |
| Monday, January 1, 2018 | 8138365000 | 22832000000 |
| Tuesday, January 1, 2019 | 8175426000 | 21708000000 |
| Wednesday, January 1, 2020 | 10116481000 | 19533000000 |
| Friday, January 1, 2021 | 16523517000 | 21804000000 |
| Saturday, January 1, 2022 | 17071284000 | 24875000000 |
| Sunday, January 1, 2023 | 9300110000 | 24119000000 |
| Monday, January 1, 2024 | 10600515000 | 24250000000 |
In pursuit of knowledge
In the competitive landscape of American transportation and logistics, Union Pacific Corporation and Expeditors International of Washington, Inc. stand as titans. Over the past decade, Union Pacific has consistently outperformed, with revenues peaking at approximately $24.9 billion in 2022, marking a 27% increase from 2014. Meanwhile, Expeditors International showcased a remarkable growth trajectory, with revenues surging by 160% from 2014 to 2022, reaching a high of $17.1 billion.
From 2014 to 2023, Union Pacific's revenue demonstrated resilience, maintaining a steady upward trend despite economic fluctuations. Expeditors, on the other hand, experienced a significant leap in 2021, with a 63% increase from the previous year, highlighting its adaptability in a dynamic market. However, 2023 saw a dip in Expeditors' revenue, indicating potential challenges ahead. This comparison underscores the diverse strategies and market conditions influencing these industry leaders.
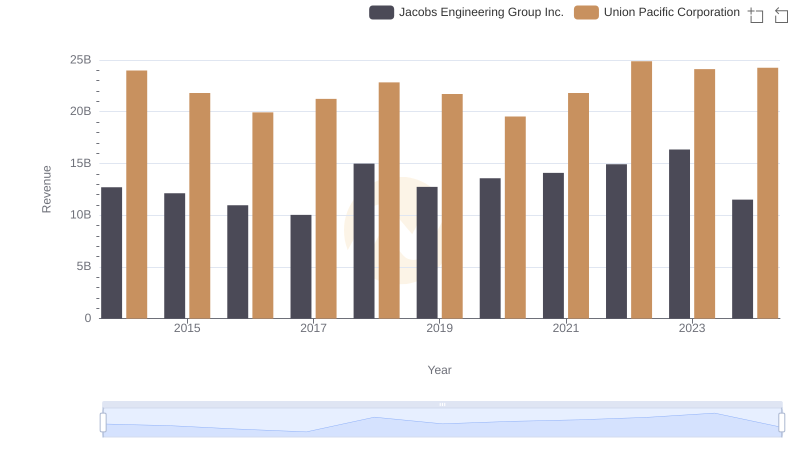
Comparing Revenue Performance: Union Pacific Corporation or Jacobs Engineering Group Inc.?
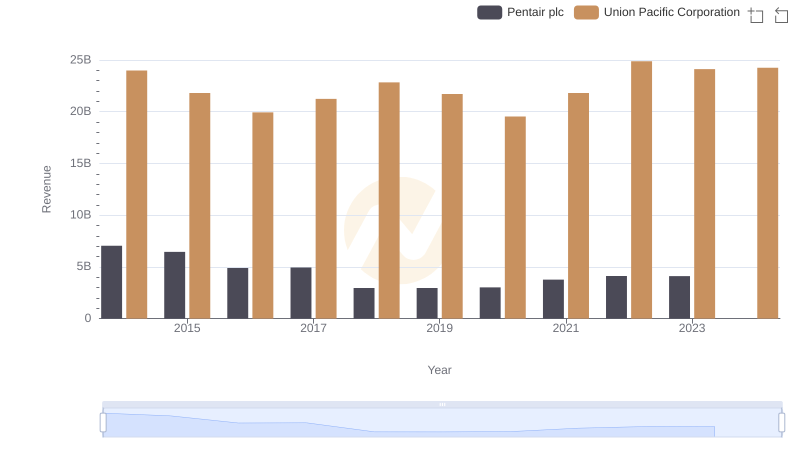
Union Pacific Corporation and Pentair plc: A Comprehensive Revenue Analysis
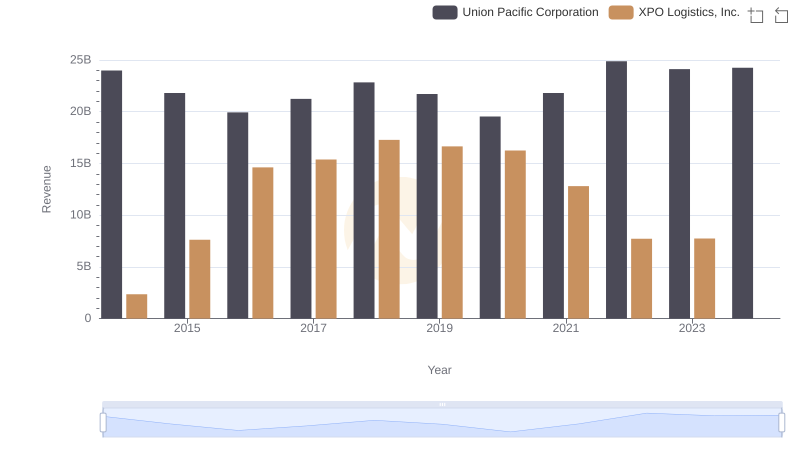
Annual Revenue Comparison: Union Pacific Corporation vs XPO Logistics, Inc.
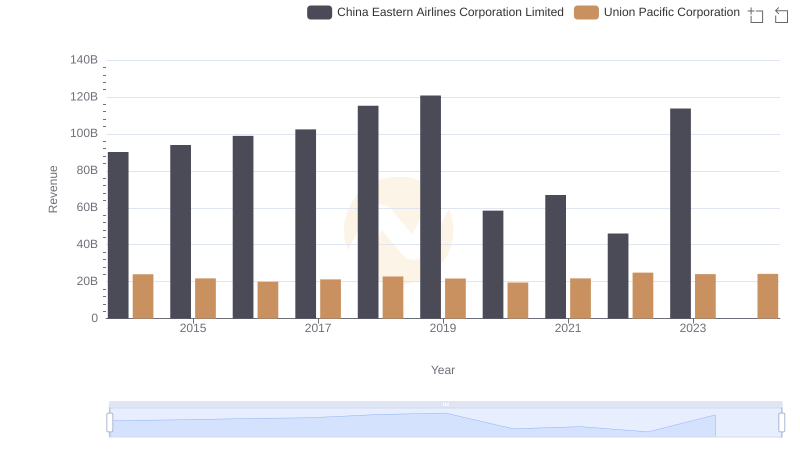
Comparing Revenue Performance: Union Pacific Corporation or China Eastern Airlines Corporation Limited?
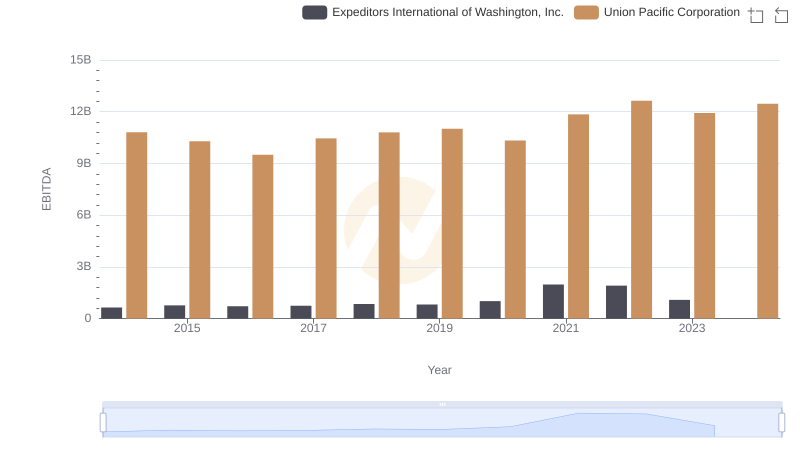
A Professional Review of EBITDA: Union Pacific Corporation Compared to Expeditors International of Washington, Inc.