| __timestamp | Union Pacific Corporation | XPO Logistics, Inc. |
|---|---|---|
| Wednesday, January 1, 2014 | 23988000000 | 2356600000 |
| Thursday, January 1, 2015 | 21813000000 | 7623200000 |
| Friday, January 1, 2016 | 19941000000 | 14619400000 |
| Sunday, January 1, 2017 | 21240000000 | 15380800000 |
| Monday, January 1, 2018 | 22832000000 | 17279000000 |
| Tuesday, January 1, 2019 | 21708000000 | 16648000000 |
| Wednesday, January 1, 2020 | 19533000000 | 16252000000 |
| Friday, January 1, 2021 | 21804000000 | 12806000000 |
| Saturday, January 1, 2022 | 24875000000 | 7718000000 |
| Sunday, January 1, 2023 | 24119000000 | 7744000000 |
| Monday, January 1, 2024 | 24250000000 | 8072000000 |
Cracking the code
In the ever-evolving landscape of the transportation industry, Union Pacific Corporation and XPO Logistics, Inc. have emerged as key players. Over the past decade, Union Pacific has consistently outperformed XPO Logistics in terms of annual revenue. From 2014 to 2023, Union Pacific's revenue grew by approximately 1% annually, peaking in 2022 with a 25% increase from its 2016 low. In contrast, XPO Logistics experienced a more volatile revenue trajectory, with a remarkable 633% increase from 2014 to 2018, before declining by 55% by 2023. This comparison highlights Union Pacific's steady growth and resilience, while XPO Logistics showcases a more dynamic, albeit fluctuating, revenue pattern. As we look to the future, the absence of 2024 data for XPO Logistics leaves room for speculation on its next strategic move.
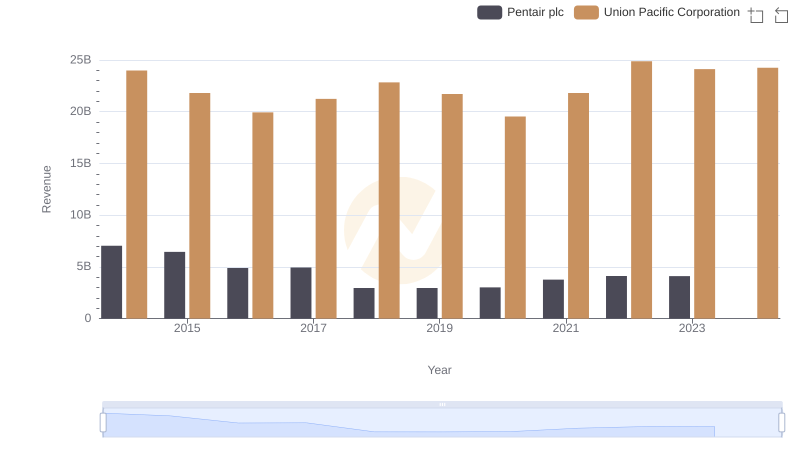
Union Pacific Corporation and Pentair plc: A Comprehensive Revenue Analysis
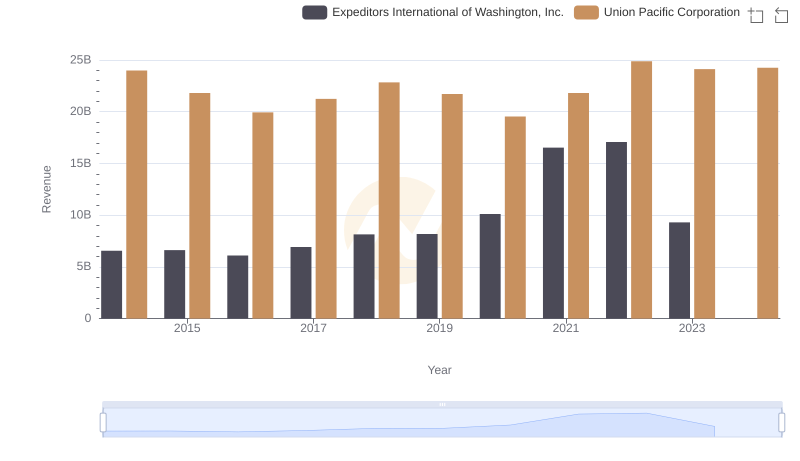
Revenue Insights: Union Pacific Corporation and Expeditors International of Washington, Inc. Performance Compared
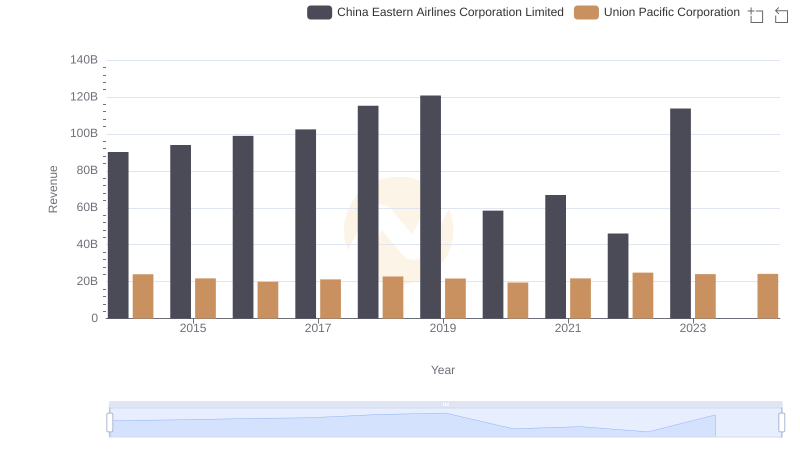
Comparing Revenue Performance: Union Pacific Corporation or China Eastern Airlines Corporation Limited?
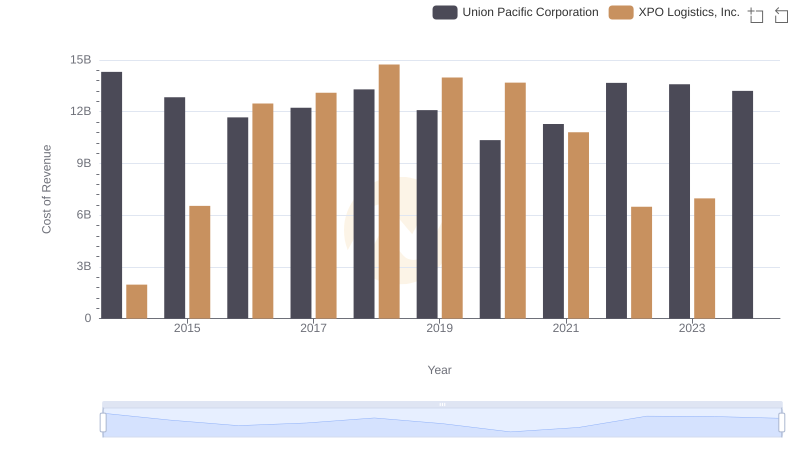
Comparing Cost of Revenue Efficiency: Union Pacific Corporation vs XPO Logistics, Inc.
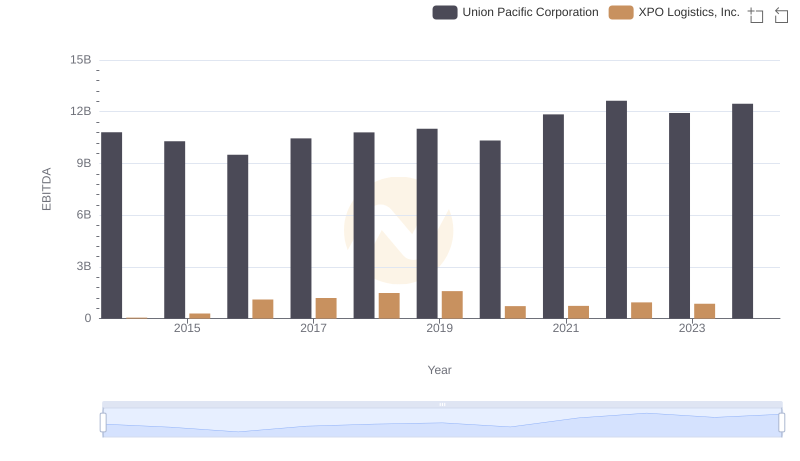
A Professional Review of EBITDA: Union Pacific Corporation Compared to XPO Logistics, Inc.