| __timestamp | Pentair plc | Union Pacific Corporation |
|---|---|---|
| Wednesday, January 1, 2014 | 2476000000 | 9677000000 |
| Thursday, January 1, 2015 | 2185800000 | 8976000000 |
| Friday, January 1, 2016 | 1794100000 | 8269000000 |
| Sunday, January 1, 2017 | 1829100000 | 9009000000 |
| Monday, January 1, 2018 | 1047700000 | 9539000000 |
| Tuesday, January 1, 2019 | 1051500000 | 9614000000 |
| Wednesday, January 1, 2020 | 1057600000 | 9179000000 |
| Friday, January 1, 2021 | 1319200000 | 10514000000 |
| Saturday, January 1, 2022 | 1364600000 | 11205000000 |
| Sunday, January 1, 2023 | 1519200000 | 10529000000 |
| Monday, January 1, 2024 | 1598800000 | 11039000000 |
Infusing magic into the data realm
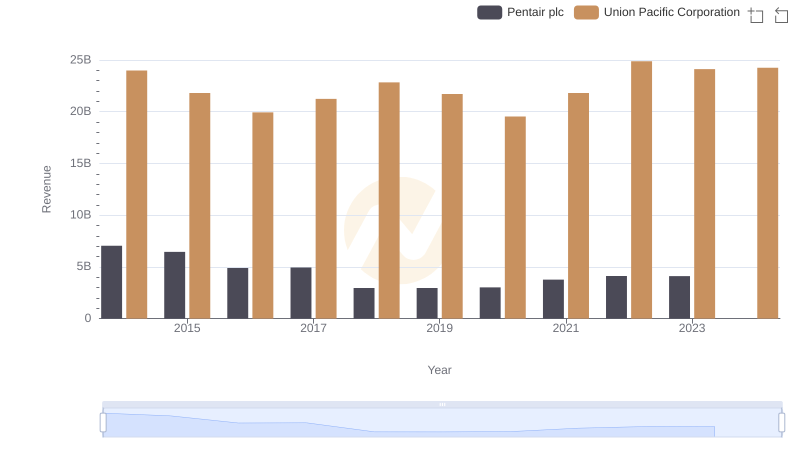
In the world of industrial giants, Union Pacific Corporation and Pentair plc stand as titans in their respective fields. Over the past decade, Union Pacific has consistently outperformed Pentair in terms of gross profit, showcasing a robust growth trajectory. From 2014 to 2023, Union Pacific's gross profit surged by approximately 14%, peaking in 2022. In contrast, Pentair experienced a decline of around 39% from its 2014 high, with a notable recovery starting in 2021.
Union Pacific's dominance is evident, with its gross profit figures consistently hovering around 6 to 7 times higher than Pentair's. The data from 2024 is incomplete, but the trend suggests Union Pacific's continued strength. This comparison not only highlights the resilience of Union Pacific but also underscores the challenges faced by Pentair in maintaining its profitability.
Stay tuned as we delve deeper into the strategies that drive these financial outcomes.

Union Pacific Corporation and Pentair plc: A Comprehensive Revenue Analysis

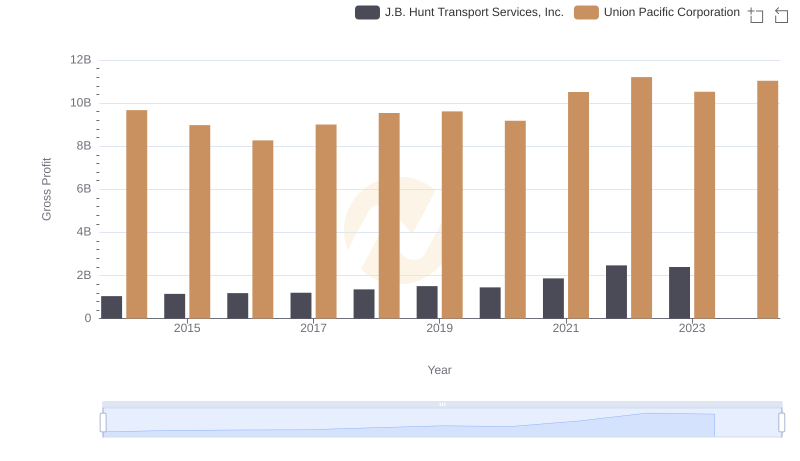
Who Generates Higher Gross Profit? Union Pacific Corporation or J.B. Hunt Transport Services, Inc.

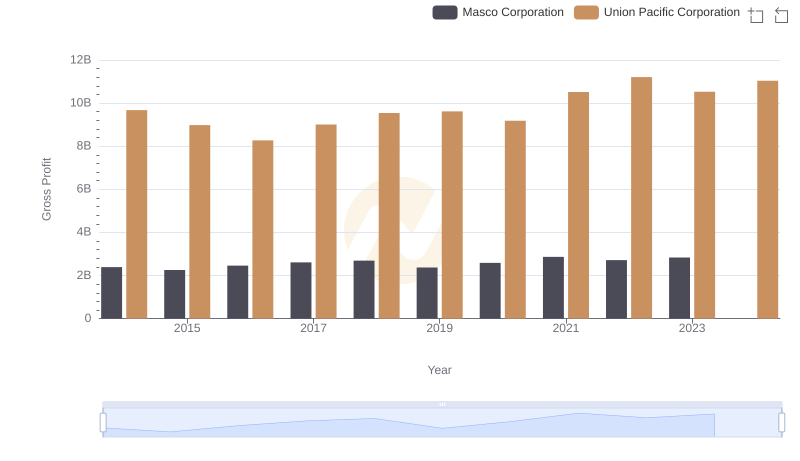
Union Pacific Corporation and Masco Corporation: A Detailed Gross Profit Analysis

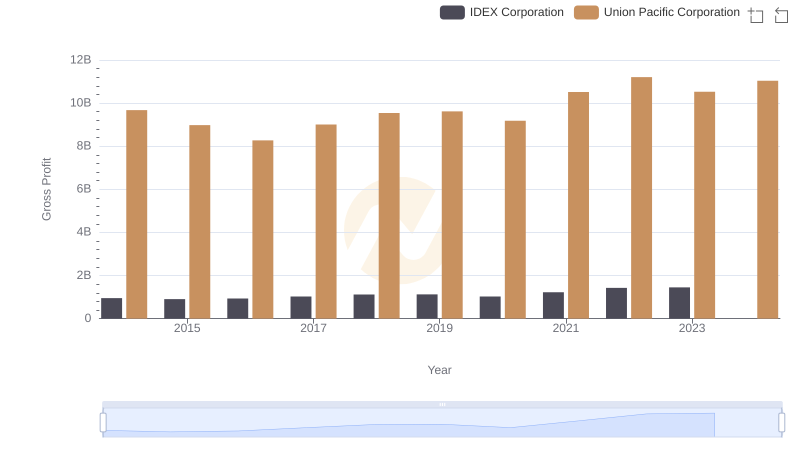
Gross Profit Trends Compared: Union Pacific Corporation vs IDEX Corporation