| __timestamp | Tyler Technologies, Inc. | Zebra Technologies Corporation |
|---|---|---|
| Wednesday, January 1, 2014 | 233371000 | 778025000 |
| Thursday, January 1, 2015 | 277187000 | 1644233000 |
| Friday, January 1, 2016 | 355351000 | 1642000000 |
| Sunday, January 1, 2017 | 399140000 | 1710000000 |
| Monday, January 1, 2018 | 439578000 | 1981000000 |
| Tuesday, January 1, 2019 | 516900000 | 2100000000 |
| Wednesday, January 1, 2020 | 542512000 | 2003000000 |
| Friday, January 1, 2021 | 709644000 | 2628000000 |
| Saturday, January 1, 2022 | 783863000 | 2624000000 |
| Sunday, January 1, 2023 | 861099000 | 2123000000 |
| Monday, January 1, 2024 | 935761000 | 2413000000 |
Igniting the spark of knowledge
In the ever-evolving landscape of technology, understanding financial performance is crucial. This analysis delves into the gross profit trends of Tyler Technologies, Inc. and Zebra Technologies Corporation from 2014 to 2023. Over this period, Tyler Technologies has seen a remarkable growth of approximately 269%, with gross profits rising from $233 million in 2014 to $861 million in 2023. Zebra Technologies, on the other hand, experienced a 173% increase, with profits climbing from $778 million to $2.123 billion in the same timeframe.
These trends highlight the dynamic nature of the tech industry and the importance of strategic financial management.
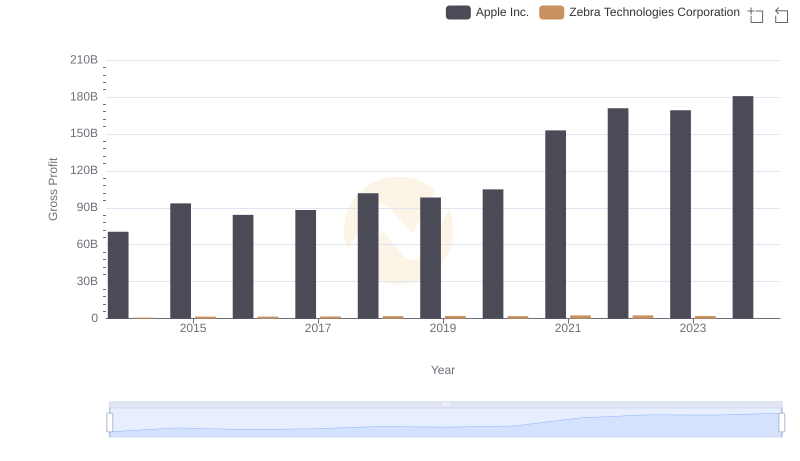
Key Insights on Gross Profit: Apple Inc. vs Zebra Technologies Corporation
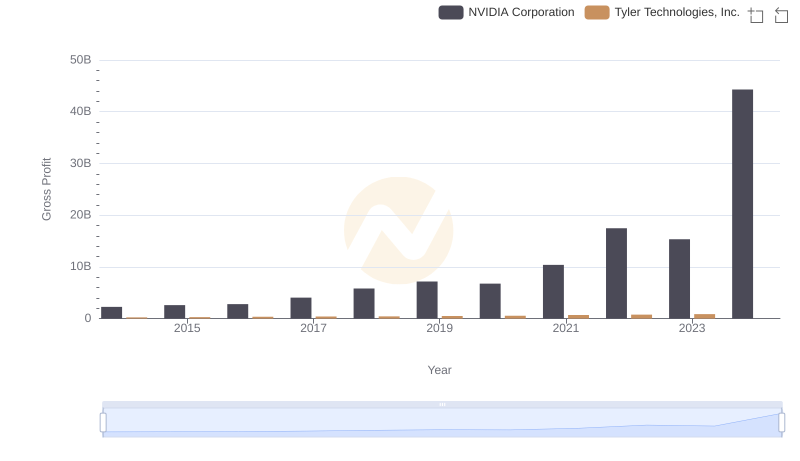
Gross Profit Comparison: NVIDIA Corporation and Tyler Technologies, Inc. Trends
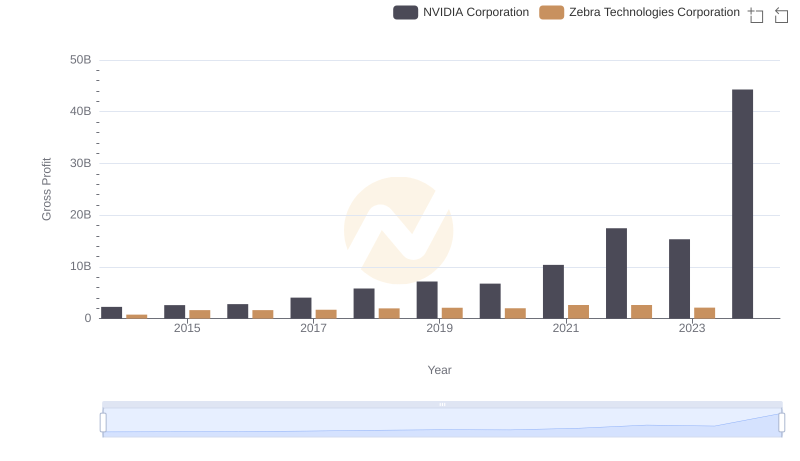
Key Insights on Gross Profit: NVIDIA Corporation vs Zebra Technologies Corporation
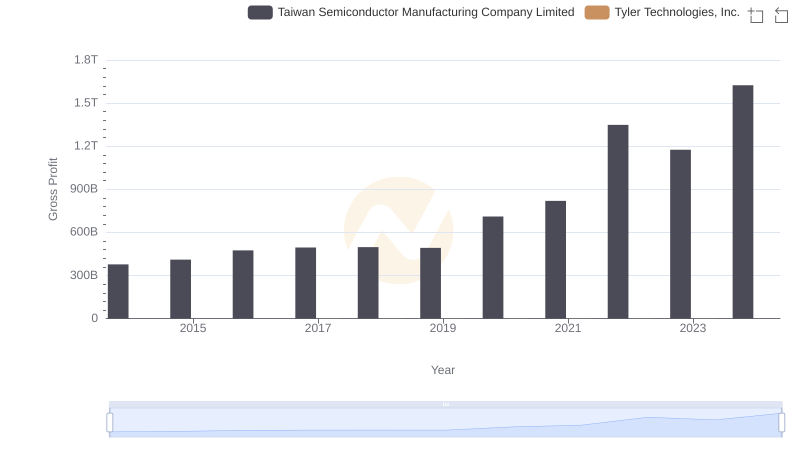
Key Insights on Gross Profit: Taiwan Semiconductor Manufacturing Company Limited vs Tyler Technologies, Inc.
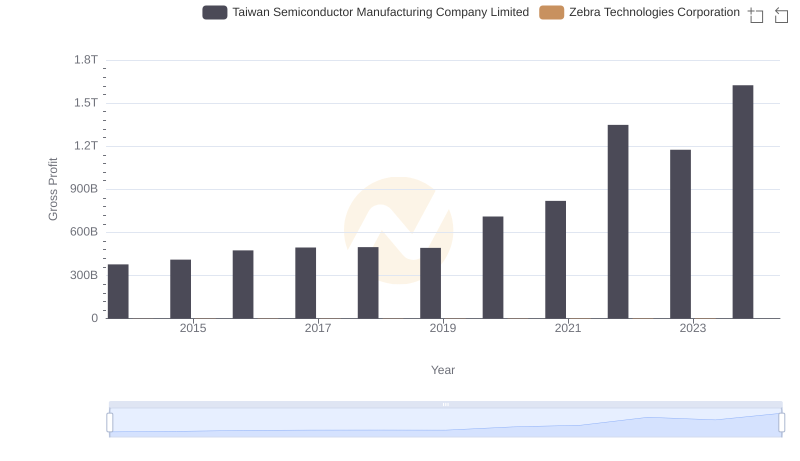
Taiwan Semiconductor Manufacturing Company Limited and Zebra Technologies Corporation: A Detailed Gross Profit Analysis
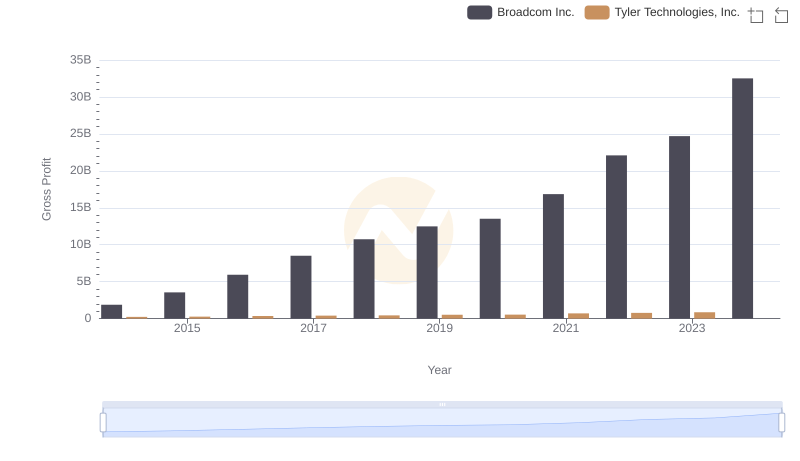
Gross Profit Trends Compared: Broadcom Inc. vs Tyler Technologies, Inc.
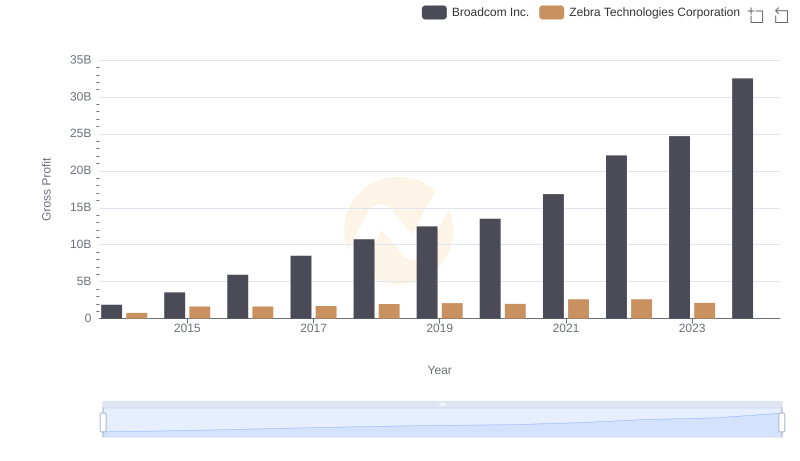
Key Insights on Gross Profit: Broadcom Inc. vs Zebra Technologies Corporation
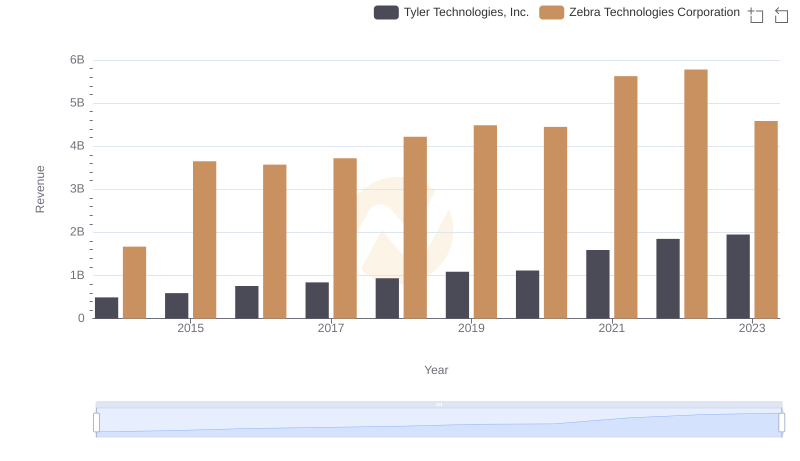
Annual Revenue Comparison: Tyler Technologies, Inc. vs Zebra Technologies Corporation
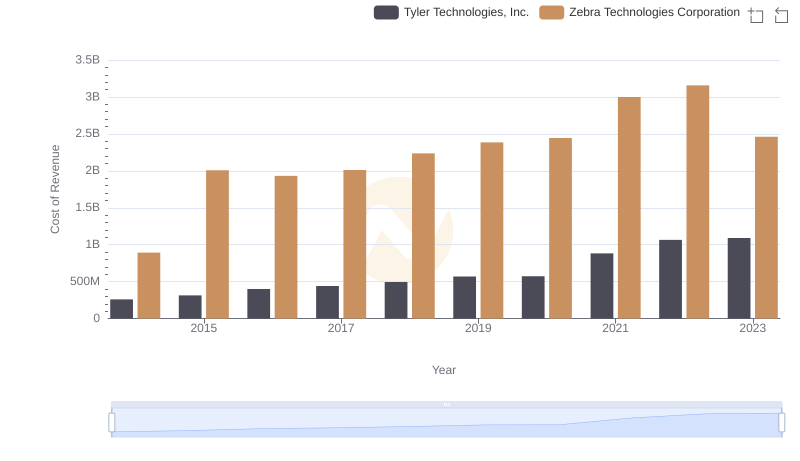
Cost of Revenue: Key Insights for Tyler Technologies, Inc. and Zebra Technologies Corporation
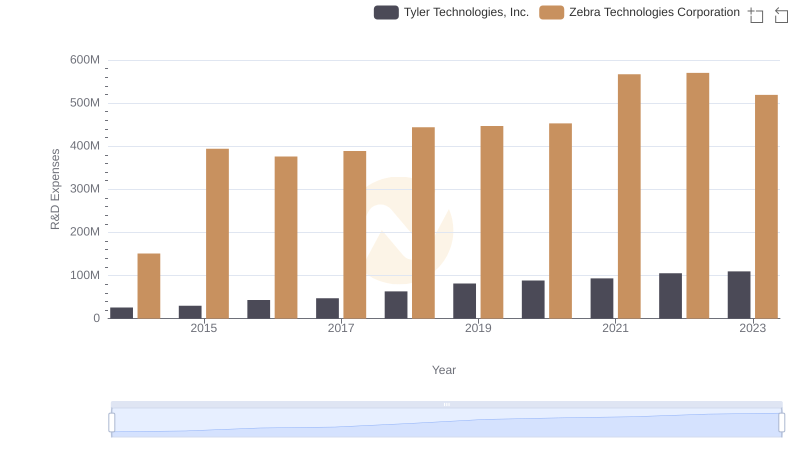
Research and Development Investment: Tyler Technologies, Inc. vs Zebra Technologies Corporation
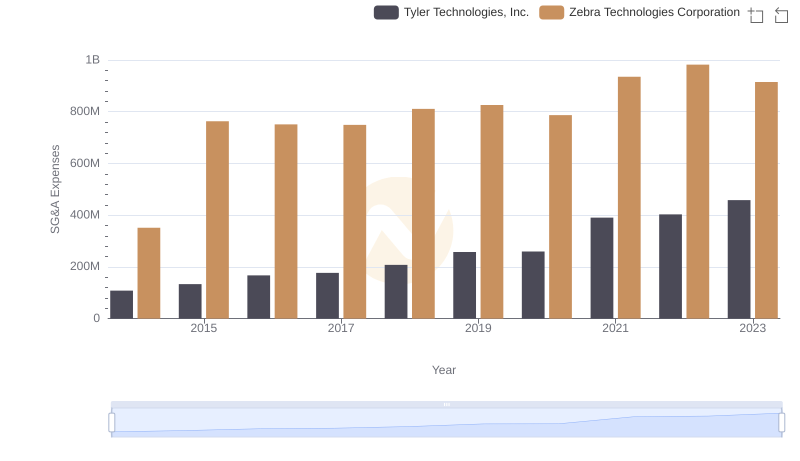
SG&A Efficiency Analysis: Comparing Tyler Technologies, Inc. and Zebra Technologies Corporation
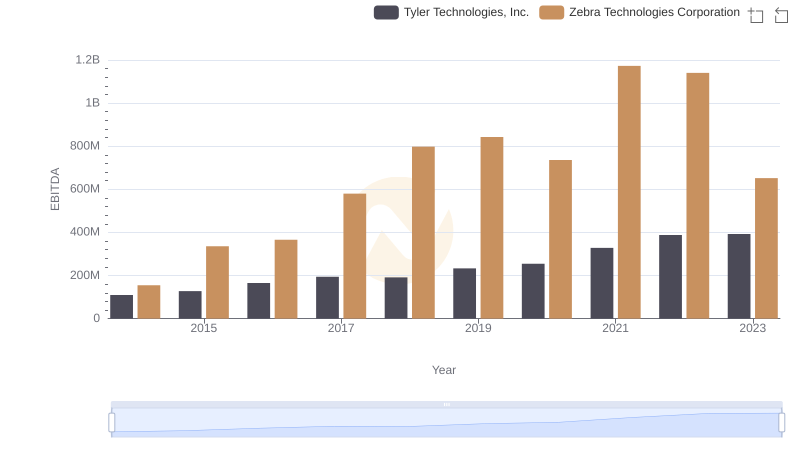
Comparative EBITDA Analysis: Tyler Technologies, Inc. vs Zebra Technologies Corporation