| __timestamp | Tyler Technologies, Inc. | Zebra Technologies Corporation |
|---|---|---|
| Wednesday, January 1, 2014 | 109427000 | 154836000 |
| Thursday, January 1, 2015 | 127617000 | 336000000 |
| Friday, January 1, 2016 | 165194000 | 366000000 |
| Sunday, January 1, 2017 | 194467000 | 580000000 |
| Monday, January 1, 2018 | 191279000 | 798000000 |
| Tuesday, January 1, 2019 | 233039000 | 843000000 |
| Wednesday, January 1, 2020 | 254583000 | 736000000 |
| Friday, January 1, 2021 | 328119000 | 1173000000 |
| Saturday, January 1, 2022 | 388013000 | 1140000000 |
| Sunday, January 1, 2023 | 392632000 | 652000000 |
| Monday, January 1, 2024 | 299526000 | 937000000 |
Unleashing insights
In the ever-evolving landscape of technology, Tyler Technologies and Zebra Technologies have showcased remarkable growth in their EBITDA over the past decade. From 2014 to 2023, Tyler Technologies saw its EBITDA surge by approximately 259%, starting from $109 million to nearly $393 million. Meanwhile, Zebra Technologies experienced a 321% increase, peaking at $1.173 billion in 2021 before settling at $652 million in 2023.
This comparative analysis underscores the dynamic nature of the tech industry, where strategic innovation and market adaptation are key to sustained financial performance.
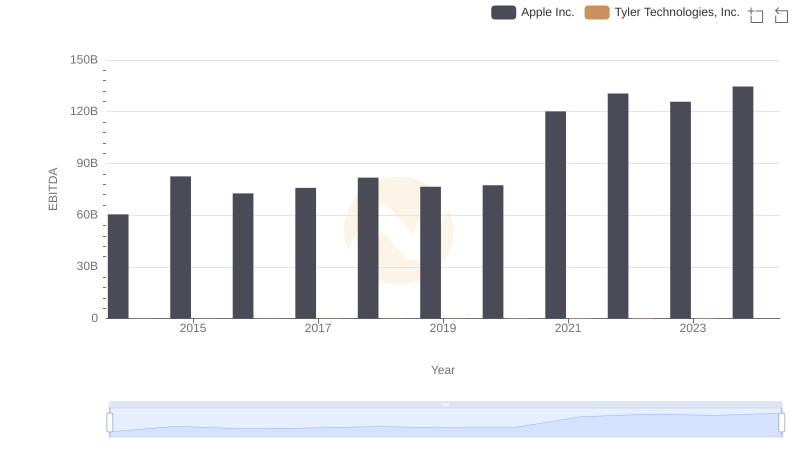
A Side-by-Side Analysis of EBITDA: Apple Inc. and Tyler Technologies, Inc.
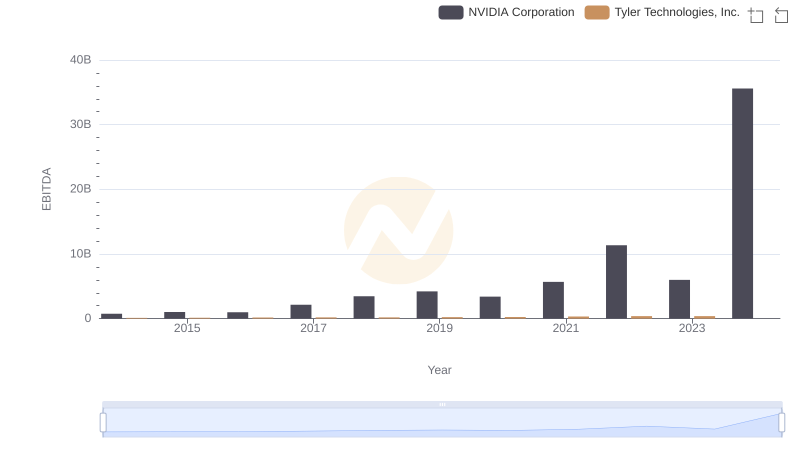
Comparative EBITDA Analysis: NVIDIA Corporation vs Tyler Technologies, Inc.
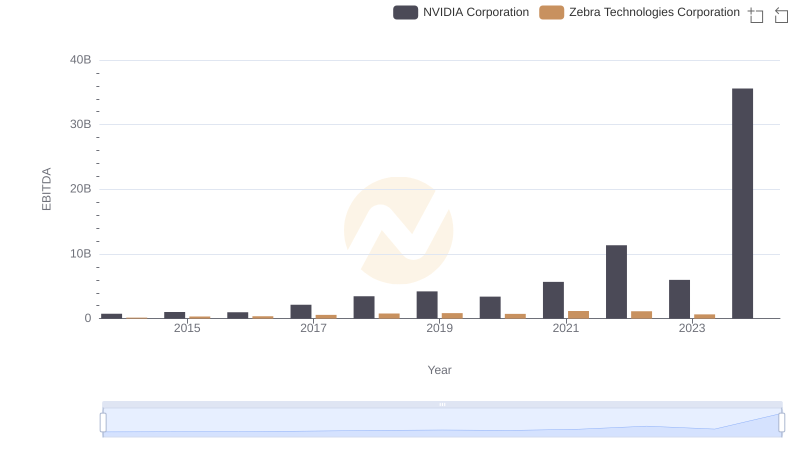
A Side-by-Side Analysis of EBITDA: NVIDIA Corporation and Zebra Technologies Corporation
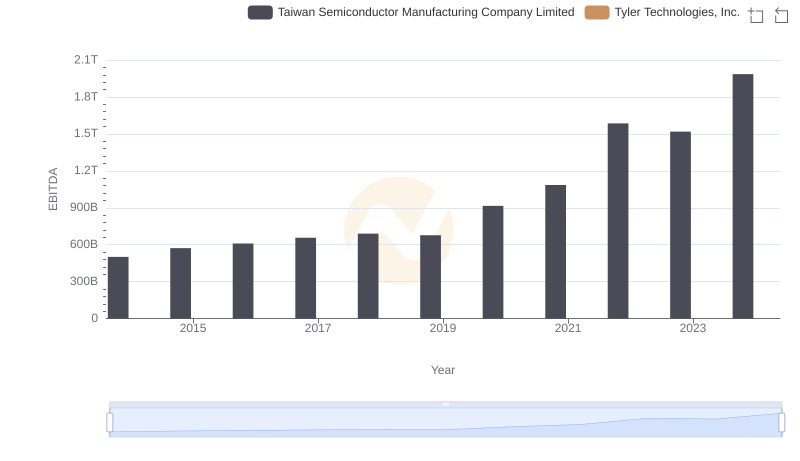
EBITDA Performance Review: Taiwan Semiconductor Manufacturing Company Limited vs Tyler Technologies, Inc.
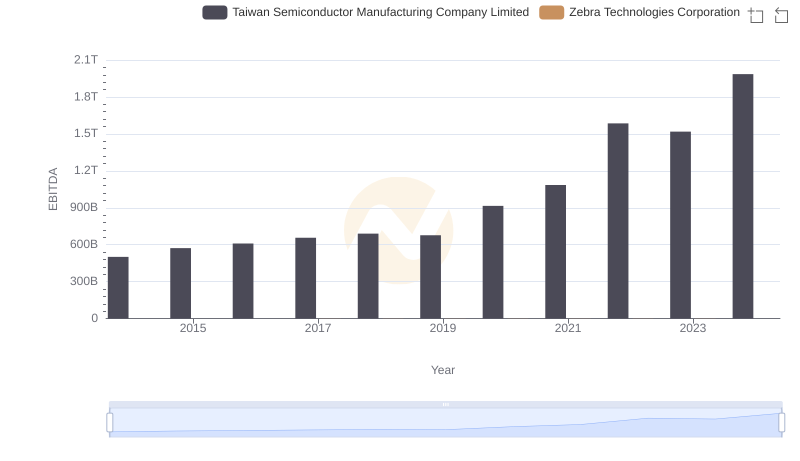
EBITDA Performance Review: Taiwan Semiconductor Manufacturing Company Limited vs Zebra Technologies Corporation
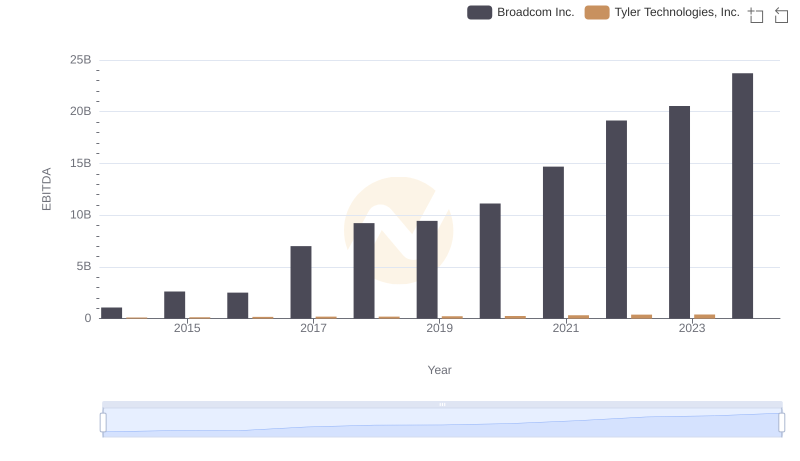
EBITDA Performance Review: Broadcom Inc. vs Tyler Technologies, Inc.
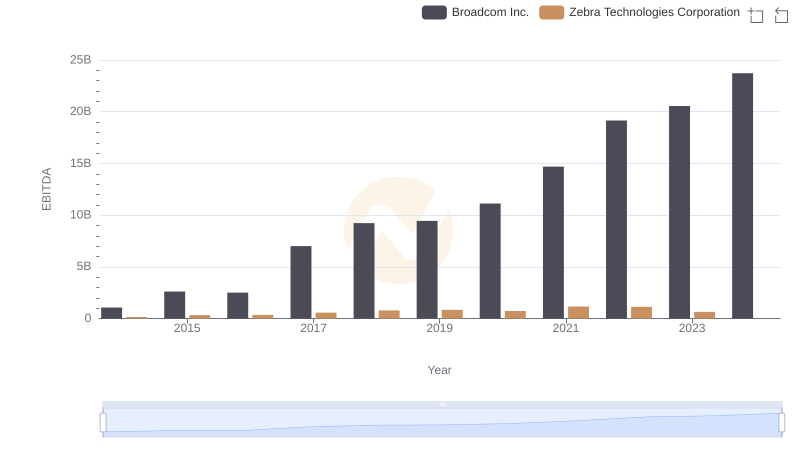
EBITDA Performance Review: Broadcom Inc. vs Zebra Technologies Corporation
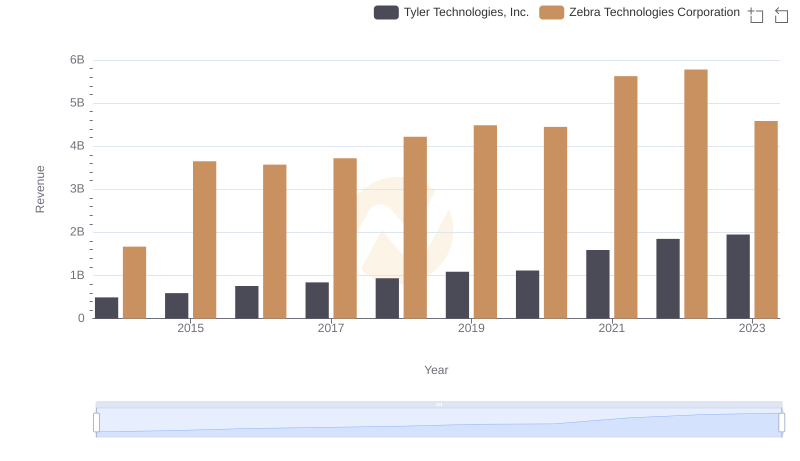
Annual Revenue Comparison: Tyler Technologies, Inc. vs Zebra Technologies Corporation
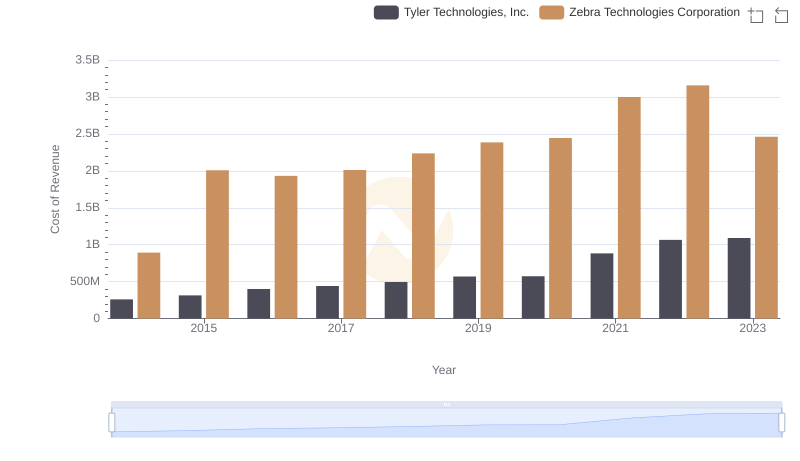
Cost of Revenue: Key Insights for Tyler Technologies, Inc. and Zebra Technologies Corporation
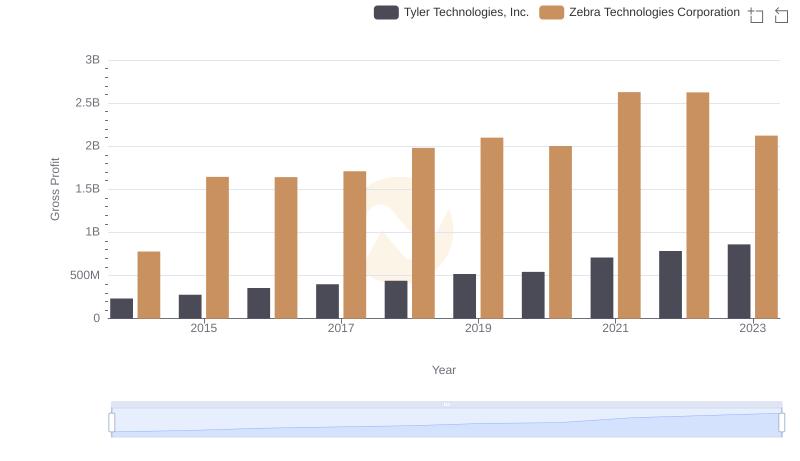
Tyler Technologies, Inc. and Zebra Technologies Corporation: A Detailed Gross Profit Analysis
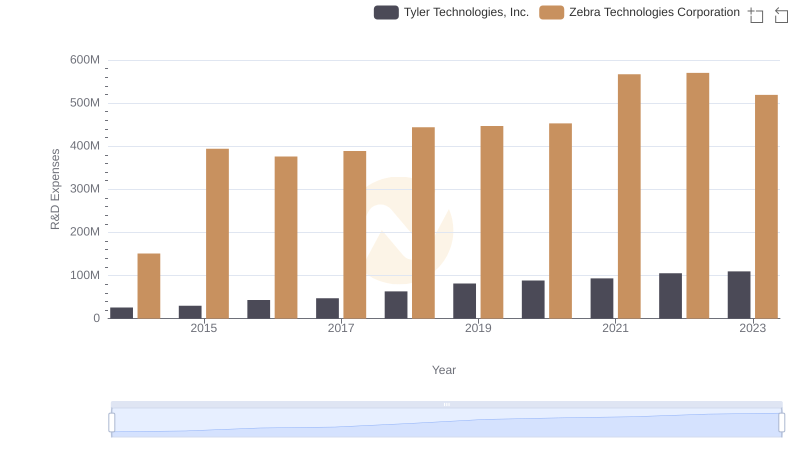
Research and Development Investment: Tyler Technologies, Inc. vs Zebra Technologies Corporation
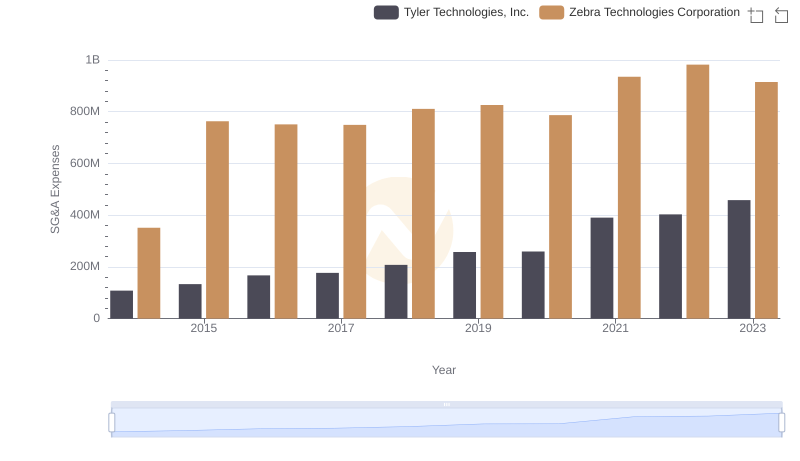
SG&A Efficiency Analysis: Comparing Tyler Technologies, Inc. and Zebra Technologies Corporation