| __timestamp | Tyler Technologies, Inc. | Zebra Technologies Corporation |
|---|---|---|
| Wednesday, January 1, 2014 | 108260000 | 351518000 |
| Thursday, January 1, 2015 | 133317000 | 763025000 |
| Friday, January 1, 2016 | 167161000 | 751000000 |
| Sunday, January 1, 2017 | 176974000 | 749000000 |
| Monday, January 1, 2018 | 207605000 | 811000000 |
| Tuesday, January 1, 2019 | 257746000 | 826000000 |
| Wednesday, January 1, 2020 | 259561000 | 787000000 |
| Friday, January 1, 2021 | 390579000 | 935000000 |
| Saturday, January 1, 2022 | 403067000 | 982000000 |
| Sunday, January 1, 2023 | 458345000 | 915000000 |
| Monday, January 1, 2024 | 458669000 | 981000000 |
Cracking the code
In the ever-evolving landscape of technology, understanding a company's operational efficiency is crucial. Tyler Technologies, Inc. and Zebra Technologies Corporation, two stalwarts in the tech industry, offer a fascinating study in SG&A (Selling, General, and Administrative) expenses over the past decade. From 2014 to 2023, Tyler Technologies saw a remarkable increase in SG&A expenses, growing by over 320%, from approximately $108 million to $458 million. Meanwhile, Zebra Technologies experienced a more modest growth of around 160%, with expenses rising from $352 million to $915 million. This divergence highlights Tyler's aggressive expansion strategy compared to Zebra's more stable approach. As companies navigate the complexities of the digital age, analyzing SG&A efficiency provides valuable insights into their strategic priorities and market positioning.
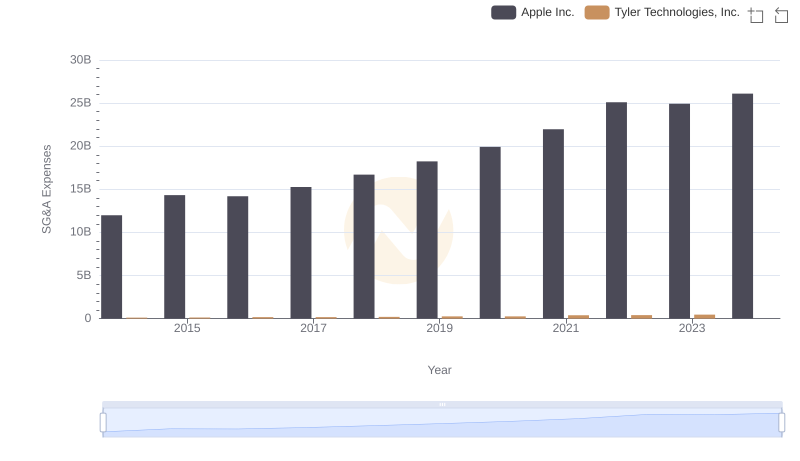
Operational Costs Compared: SG&A Analysis of Apple Inc. and Tyler Technologies, Inc.
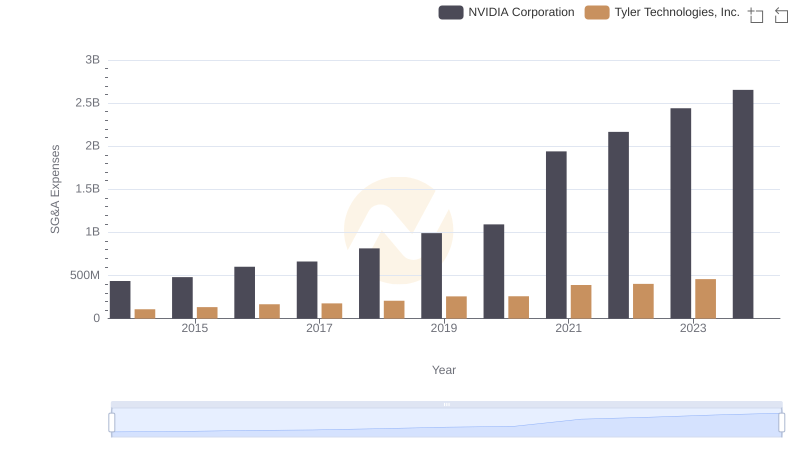
Comparing SG&A Expenses: NVIDIA Corporation vs Tyler Technologies, Inc. Trends and Insights
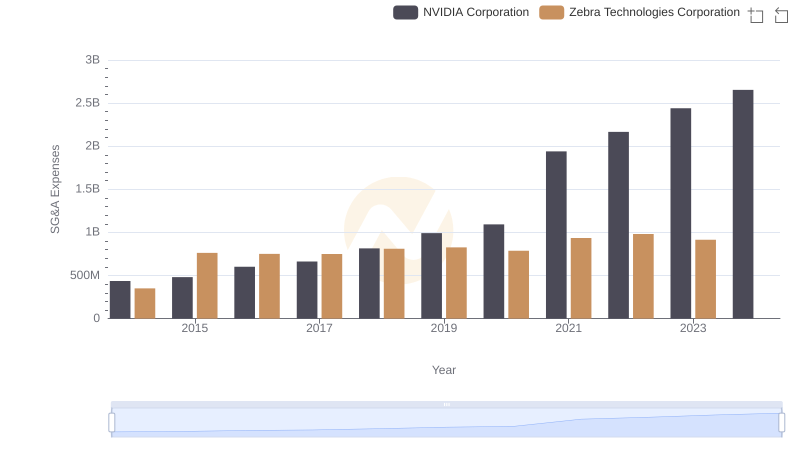
Who Optimizes SG&A Costs Better? NVIDIA Corporation or Zebra Technologies Corporation
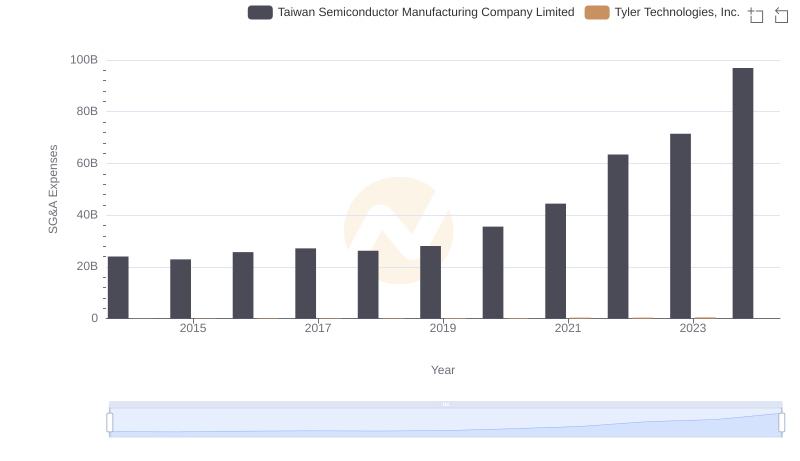
SG&A Efficiency Analysis: Comparing Taiwan Semiconductor Manufacturing Company Limited and Tyler Technologies, Inc.
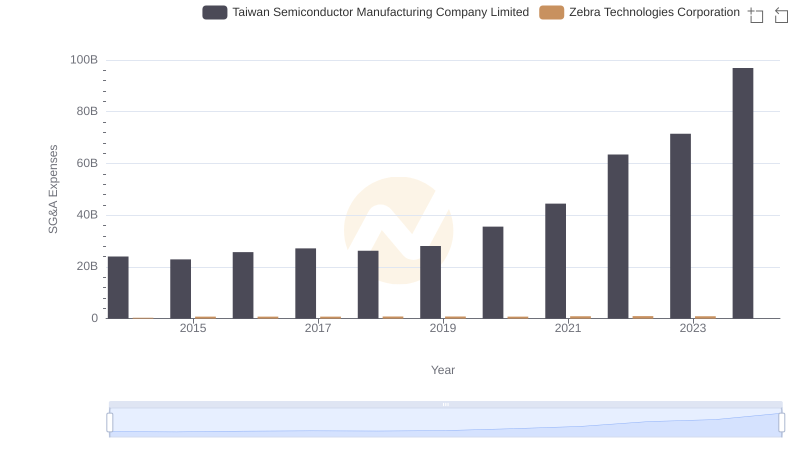
Cost Management Insights: SG&A Expenses for Taiwan Semiconductor Manufacturing Company Limited and Zebra Technologies Corporation
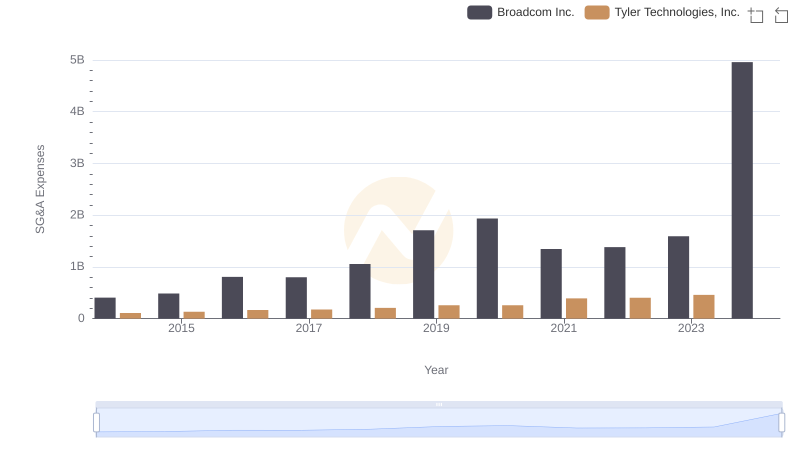
Cost Management Insights: SG&A Expenses for Broadcom Inc. and Tyler Technologies, Inc.
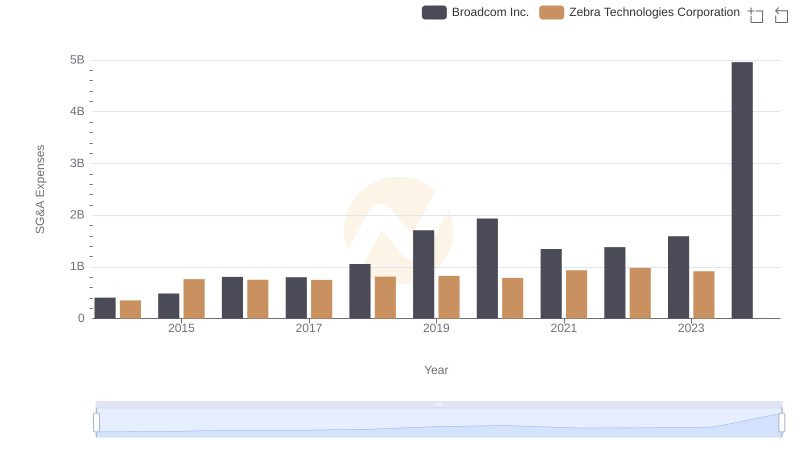
Broadcom Inc. vs Zebra Technologies Corporation: SG&A Expense Trends
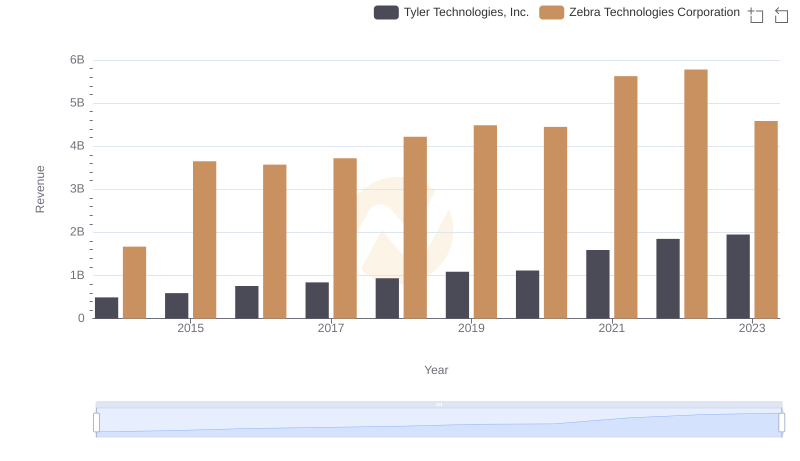
Annual Revenue Comparison: Tyler Technologies, Inc. vs Zebra Technologies Corporation
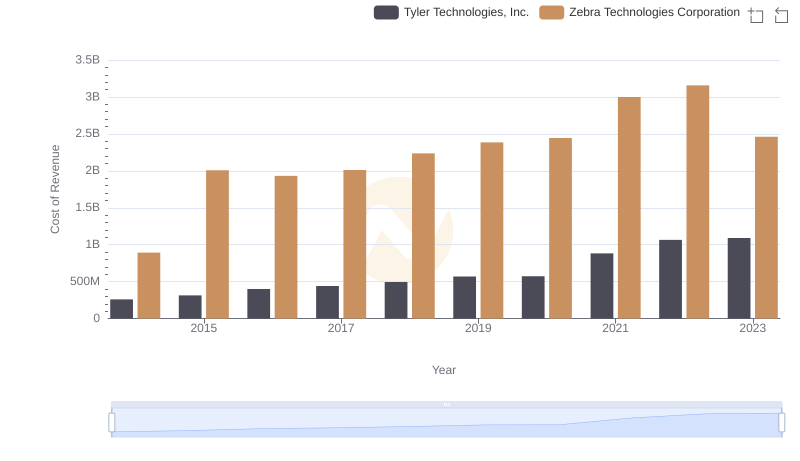
Cost of Revenue: Key Insights for Tyler Technologies, Inc. and Zebra Technologies Corporation
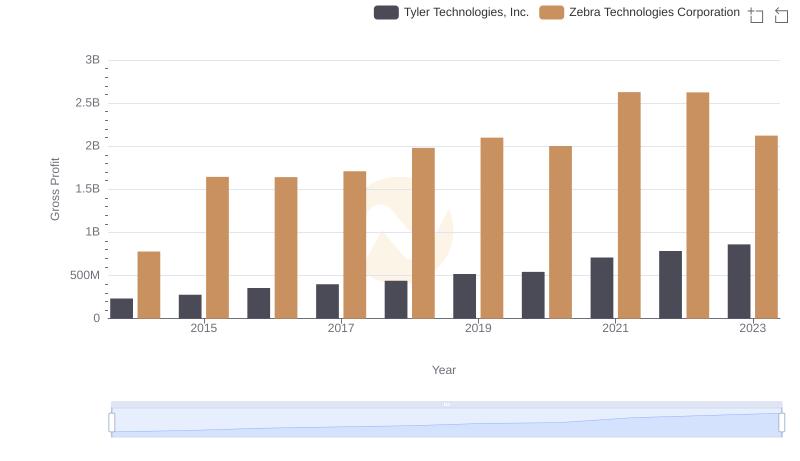
Tyler Technologies, Inc. and Zebra Technologies Corporation: A Detailed Gross Profit Analysis
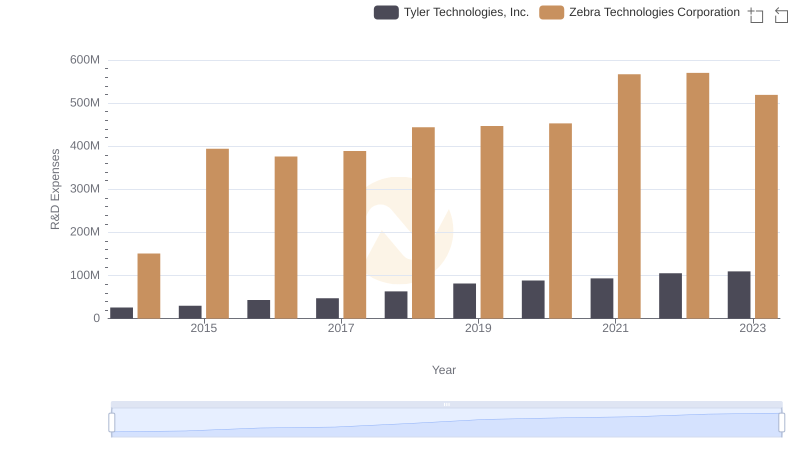
Research and Development Investment: Tyler Technologies, Inc. vs Zebra Technologies Corporation
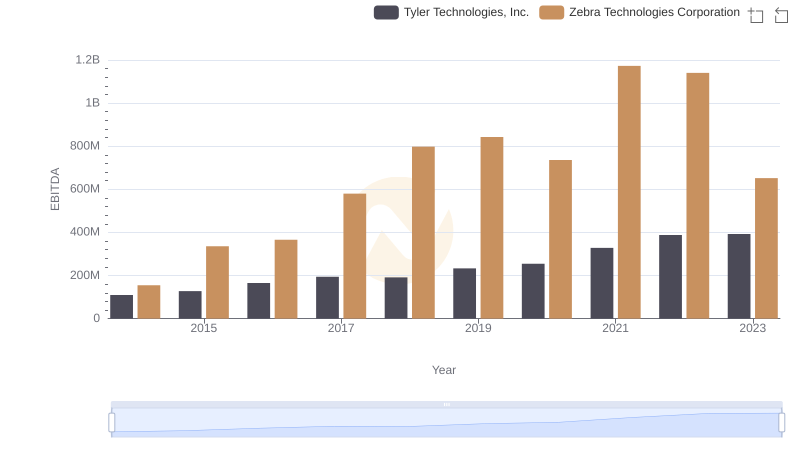
Comparative EBITDA Analysis: Tyler Technologies, Inc. vs Zebra Technologies Corporation