| __timestamp | Tyler Technologies, Inc. | Zebra Technologies Corporation |
|---|---|---|
| Wednesday, January 1, 2014 | 259730000 | 892547000 |
| Thursday, January 1, 2015 | 313835000 | 2007739000 |
| Friday, January 1, 2016 | 400692000 | 1932000000 |
| Sunday, January 1, 2017 | 441522000 | 2012000000 |
| Monday, January 1, 2018 | 495704000 | 2237000000 |
| Tuesday, January 1, 2019 | 569527000 | 2385000000 |
| Wednesday, January 1, 2020 | 574151000 | 2445000000 |
| Friday, January 1, 2021 | 882643000 | 2999000000 |
| Saturday, January 1, 2022 | 1066341000 | 3157000000 |
| Sunday, January 1, 2023 | 1090652000 | 2461000000 |
| Monday, January 1, 2024 | 1202042000 | 2568000000 |
Unleashing insights
In the ever-evolving tech industry, understanding cost structures is crucial for investors and stakeholders. Tyler Technologies, Inc. and Zebra Technologies Corporation, two giants in their respective fields, have shown distinct trends in their cost of revenue over the past decade. From 2014 to 2023, Tyler Technologies saw a steady increase, with costs rising from approximately $260 million to over $1 billion, marking a growth of over 300%. Meanwhile, Zebra Technologies experienced a more fluctuating pattern, peaking in 2022 at around $3.16 billion before slightly declining in 2023. This represents a 176% increase from their 2014 figures. These trends highlight the dynamic nature of operational costs in the tech sector, influenced by factors such as market expansion, technological advancements, and economic conditions. As we move forward, monitoring these trends will be essential for strategic planning and investment decisions.
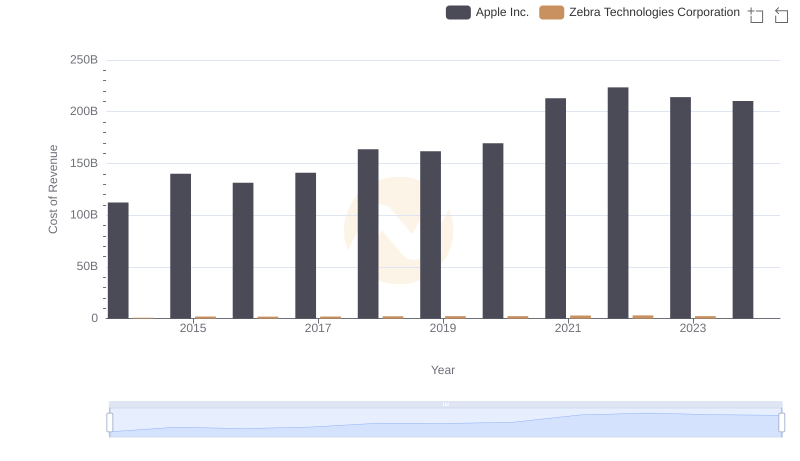
Apple Inc. vs Zebra Technologies Corporation: Efficiency in Cost of Revenue Explored
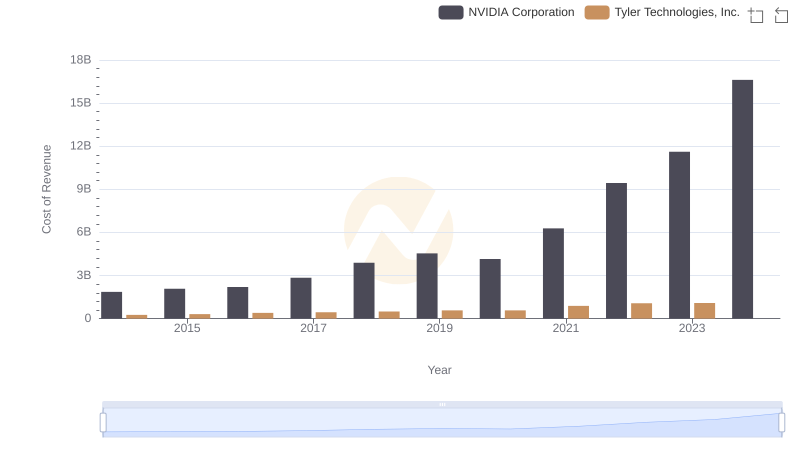
Analyzing Cost of Revenue: NVIDIA Corporation and Tyler Technologies, Inc.
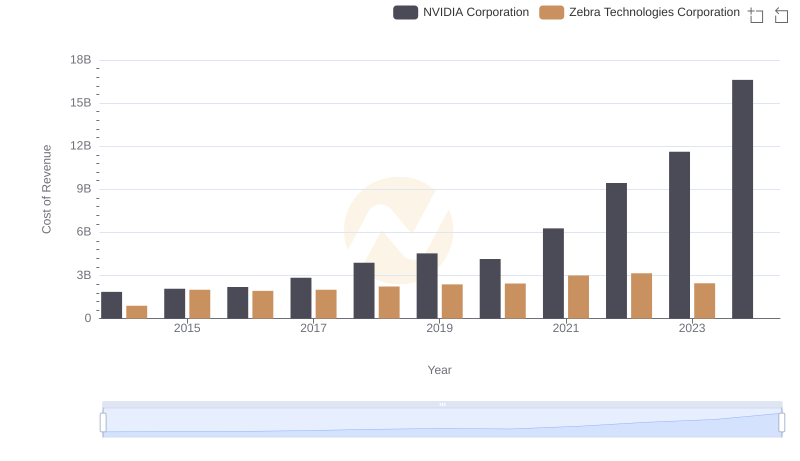
Cost of Revenue: Key Insights for NVIDIA Corporation and Zebra Technologies Corporation
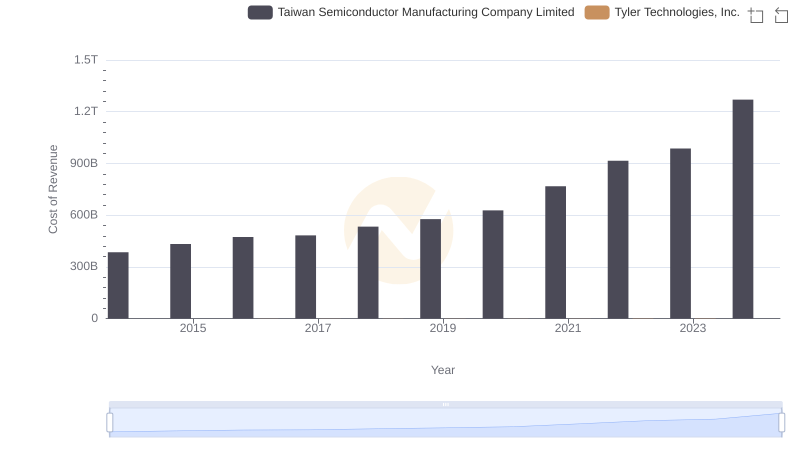
Cost of Revenue Comparison: Taiwan Semiconductor Manufacturing Company Limited vs Tyler Technologies, Inc.
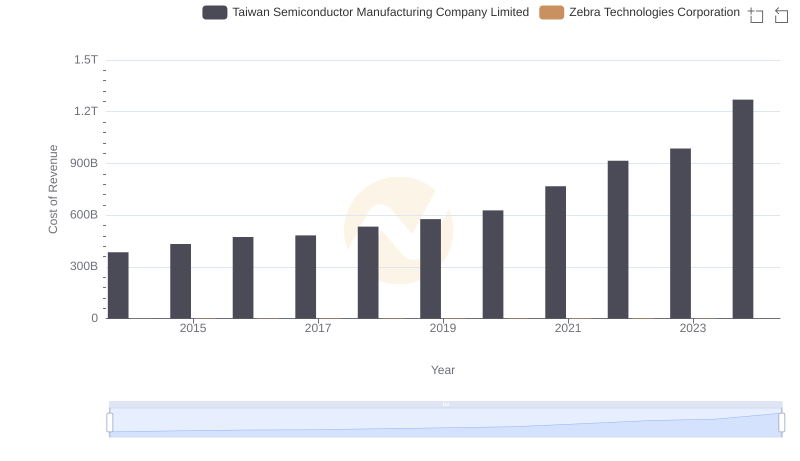
Cost of Revenue: Key Insights for Taiwan Semiconductor Manufacturing Company Limited and Zebra Technologies Corporation
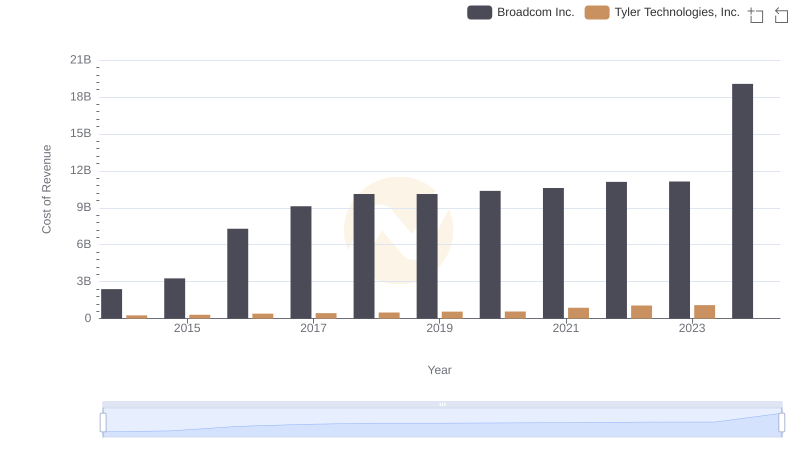
Cost of Revenue: Key Insights for Broadcom Inc. and Tyler Technologies, Inc.
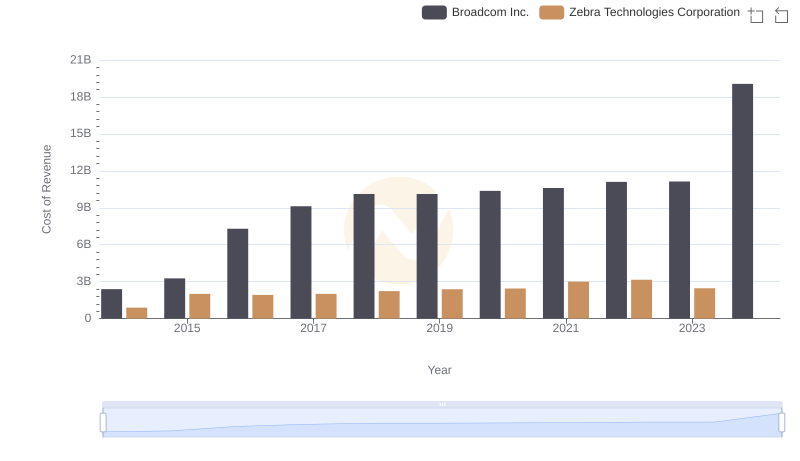
Broadcom Inc. vs Zebra Technologies Corporation: Efficiency in Cost of Revenue Explored
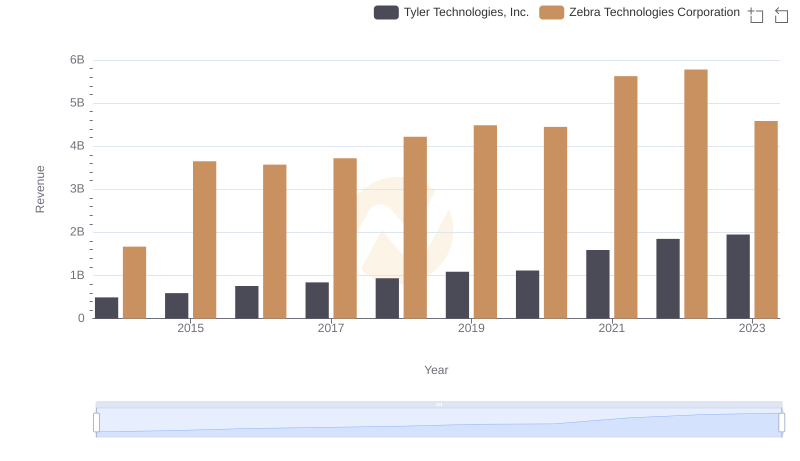
Annual Revenue Comparison: Tyler Technologies, Inc. vs Zebra Technologies Corporation
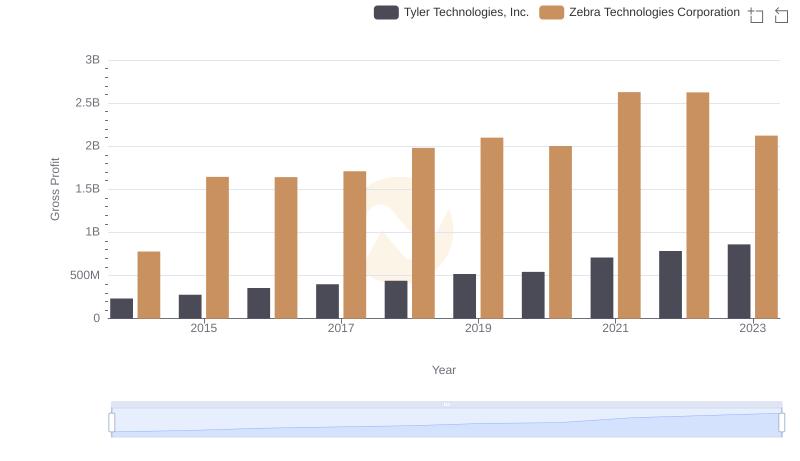
Tyler Technologies, Inc. and Zebra Technologies Corporation: A Detailed Gross Profit Analysis
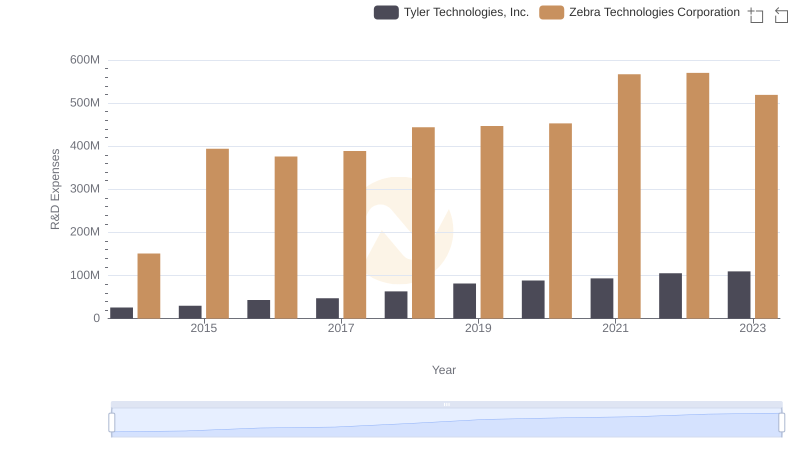
Research and Development Investment: Tyler Technologies, Inc. vs Zebra Technologies Corporation
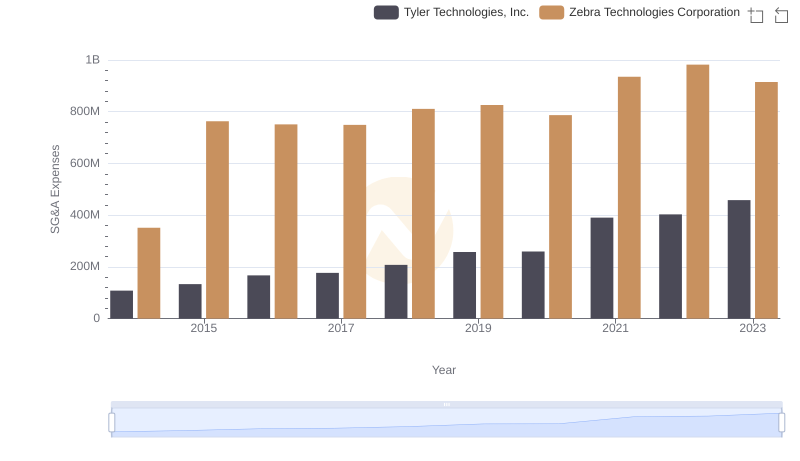
SG&A Efficiency Analysis: Comparing Tyler Technologies, Inc. and Zebra Technologies Corporation
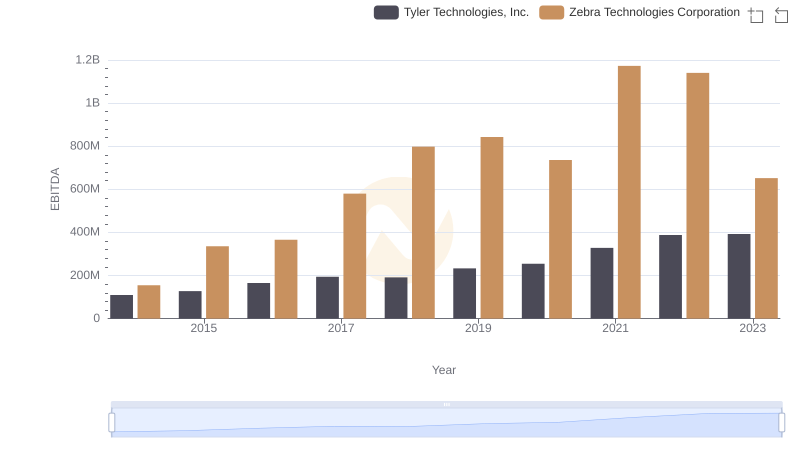
Comparative EBITDA Analysis: Tyler Technologies, Inc. vs Zebra Technologies Corporation