| __timestamp | Tyler Technologies, Inc. | Zebra Technologies Corporation |
|---|---|---|
| Wednesday, January 1, 2014 | 493101000 | 1670572000 |
| Thursday, January 1, 2015 | 591022000 | 3651972000 |
| Friday, January 1, 2016 | 756043000 | 3574000000 |
| Sunday, January 1, 2017 | 840662000 | 3722000000 |
| Monday, January 1, 2018 | 935282000 | 4218000000 |
| Tuesday, January 1, 2019 | 1086427000 | 4485000000 |
| Wednesday, January 1, 2020 | 1116663000 | 4448000000 |
| Friday, January 1, 2021 | 1592287000 | 5627000000 |
| Saturday, January 1, 2022 | 1850204000 | 5781000000 |
| Sunday, January 1, 2023 | 1951751000 | 4584000000 |
| Monday, January 1, 2024 | 2137803000 | 4981000000 |
Unleashing insights
In the ever-evolving landscape of technology, Tyler Technologies, Inc. and Zebra Technologies Corporation have emerged as significant players. Over the past decade, from 2014 to 2023, these companies have demonstrated remarkable revenue growth, albeit at different scales. Tyler Technologies, a leader in public sector software solutions, has seen its revenue nearly quadruple, starting from approximately $493 million in 2014 to an impressive $1.95 billion in 2023. This represents a robust annual growth rate, reflecting its expanding influence in the market.
On the other hand, Zebra Technologies, known for its innovative enterprise asset intelligence solutions, has maintained a strong revenue stream, peaking at $5.78 billion in 2022. Despite a slight dip in 2023, Zebra's revenue has consistently outpaced Tyler's, highlighting its dominant market position. This comparison underscores the dynamic nature of the tech industry, where both companies continue to innovate and adapt to changing market demands.
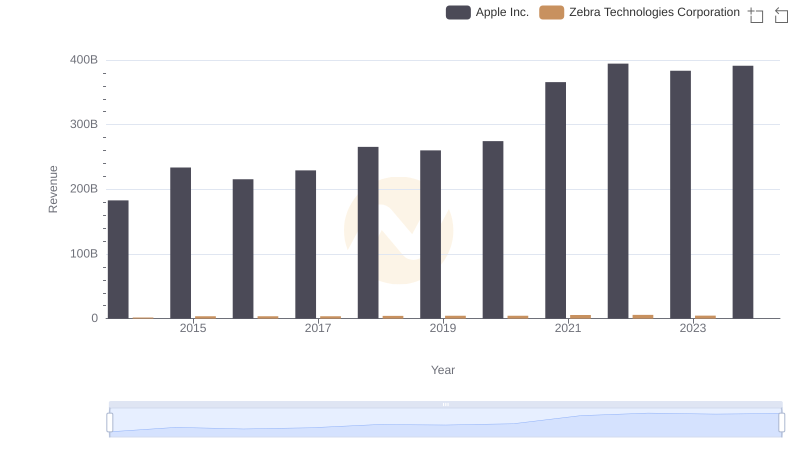
Revenue Insights: Apple Inc. and Zebra Technologies Corporation Performance Compared

NVIDIA Corporation vs Tyler Technologies, Inc.: Annual Revenue Growth Compared
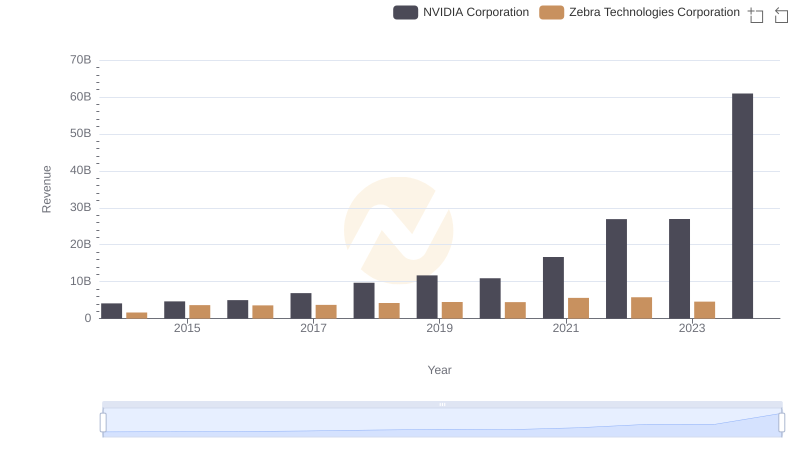
NVIDIA Corporation vs Zebra Technologies Corporation: Examining Key Revenue Metrics
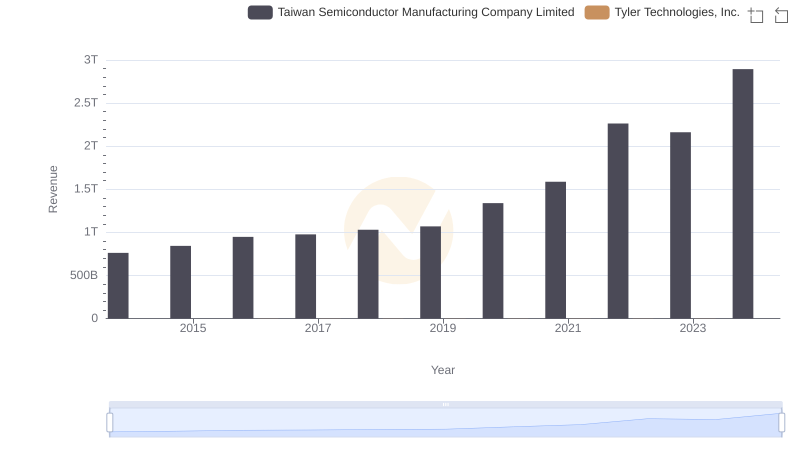
Taiwan Semiconductor Manufacturing Company Limited or Tyler Technologies, Inc.: Who Leads in Yearly Revenue?
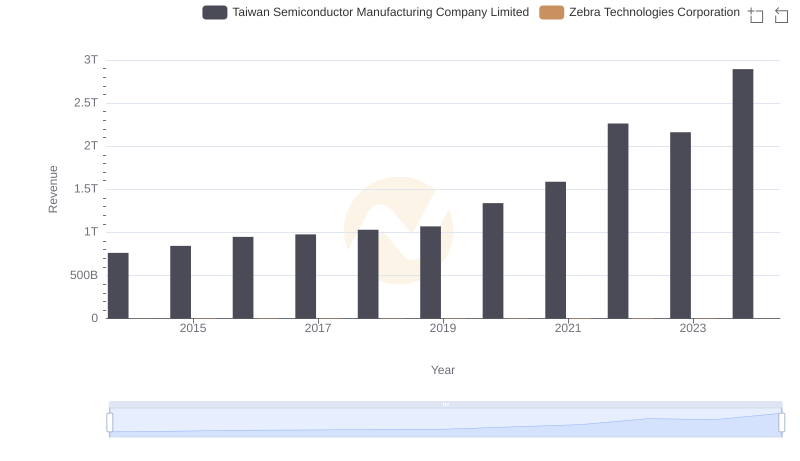
Taiwan Semiconductor Manufacturing Company Limited and Zebra Technologies Corporation: A Comprehensive Revenue Analysis
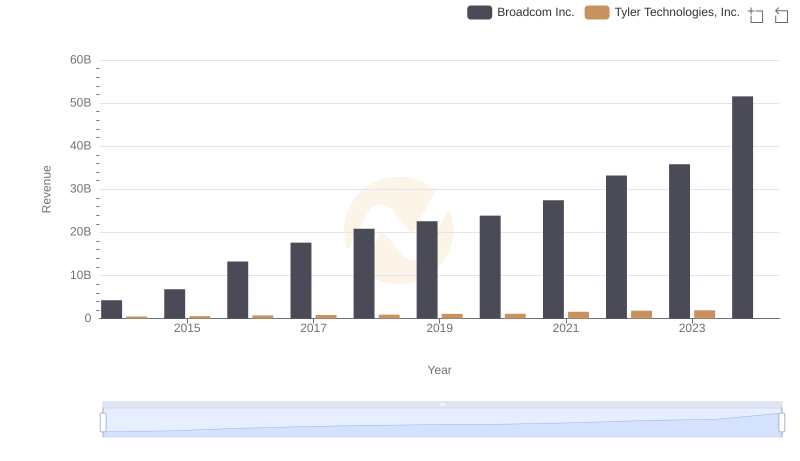
Broadcom Inc. vs Tyler Technologies, Inc.: Annual Revenue Growth Compared
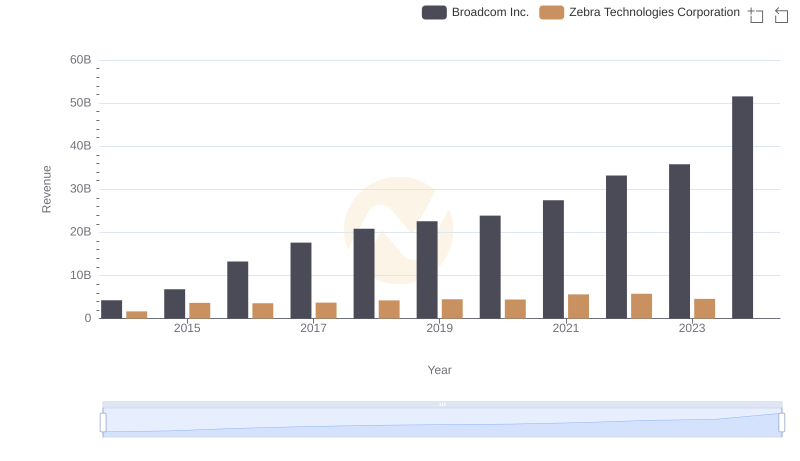
Revenue Insights: Broadcom Inc. and Zebra Technologies Corporation Performance Compared
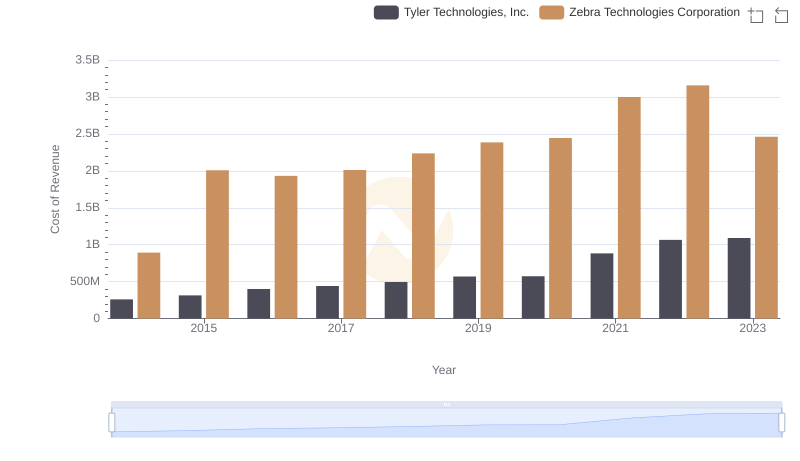
Cost of Revenue: Key Insights for Tyler Technologies, Inc. and Zebra Technologies Corporation
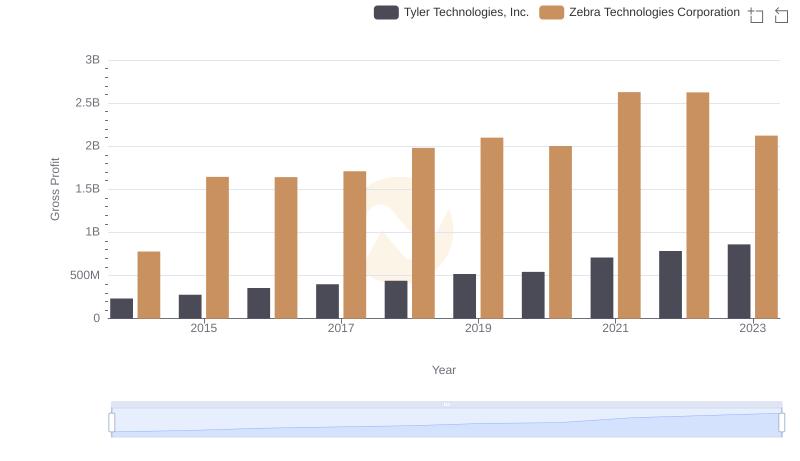
Tyler Technologies, Inc. and Zebra Technologies Corporation: A Detailed Gross Profit Analysis
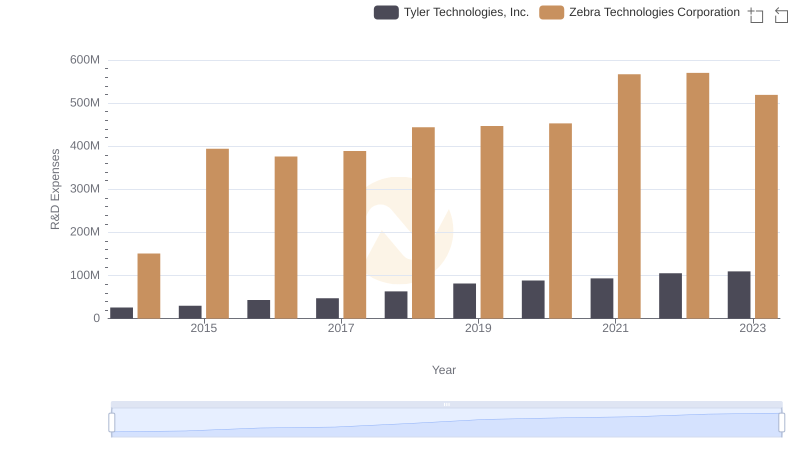
Research and Development Investment: Tyler Technologies, Inc. vs Zebra Technologies Corporation
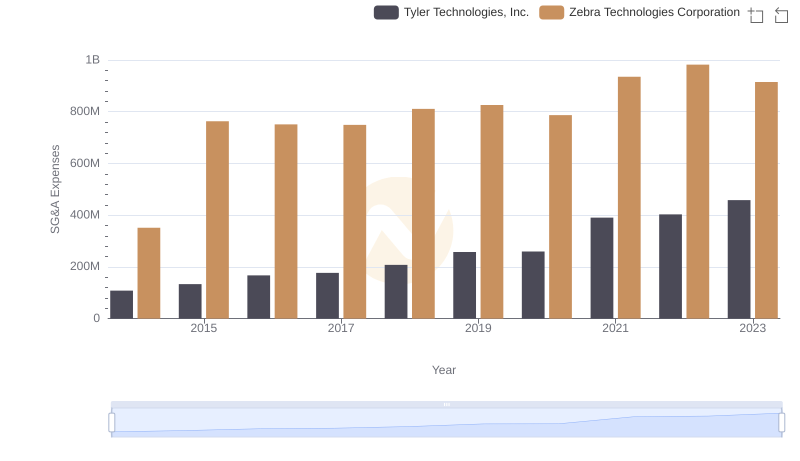
SG&A Efficiency Analysis: Comparing Tyler Technologies, Inc. and Zebra Technologies Corporation
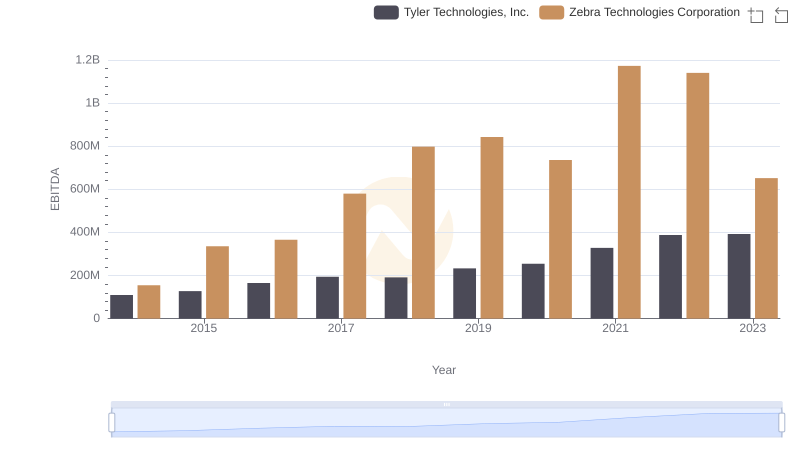
Comparative EBITDA Analysis: Tyler Technologies, Inc. vs Zebra Technologies Corporation