| __timestamp | TFI International Inc. | Trane Technologies plc |
|---|---|---|
| Wednesday, January 1, 2014 | 2782605137 | 8982800000 |
| Thursday, January 1, 2015 | 2551474032 | 9301600000 |
| Friday, January 1, 2016 | 2636493564 | 9329300000 |
| Sunday, January 1, 2017 | 3364979721 | 9811600000 |
| Monday, January 1, 2018 | 3251443800 | 10847600000 |
| Tuesday, January 1, 2019 | 3461987950 | 11451500000 |
| Wednesday, January 1, 2020 | 3239249000 | 8651300000 |
| Friday, January 1, 2021 | 6182566000 | 9666800000 |
| Saturday, January 1, 2022 | 7385640000 | 11026900000 |
| Sunday, January 1, 2023 | 6255775000 | 11820400000 |
| Monday, January 1, 2024 | 12757700000 |
Infusing magic into the data realm
In the ever-evolving landscape of industrial giants, understanding cost efficiency is paramount. Trane Technologies plc and TFI International Inc. have been pivotal players in their respective sectors. From 2014 to 2023, Trane Technologies consistently maintained a higher cost of revenue, peaking at approximately $11.8 billion in 2023. In contrast, TFI International's cost of revenue saw a significant rise, reaching around $7.4 billion in 2022, marking a 166% increase from 2014.
Over the past decade, Trane Technologies' cost of revenue fluctuated, with a notable dip in 2020, likely due to global economic disruptions. Meanwhile, TFI International demonstrated a robust upward trend, particularly from 2020 onwards, reflecting strategic expansions and acquisitions. This comparative analysis highlights the diverse strategies employed by these corporations to navigate economic challenges and capitalize on growth opportunities.
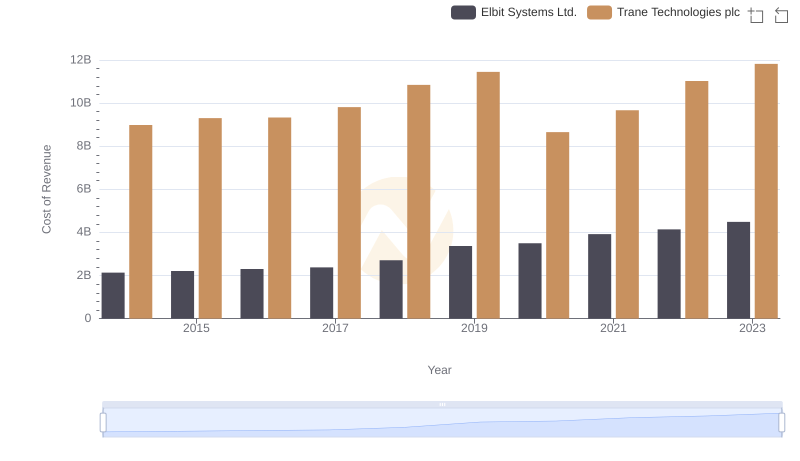
Cost of Revenue Comparison: Trane Technologies plc vs Elbit Systems Ltd.
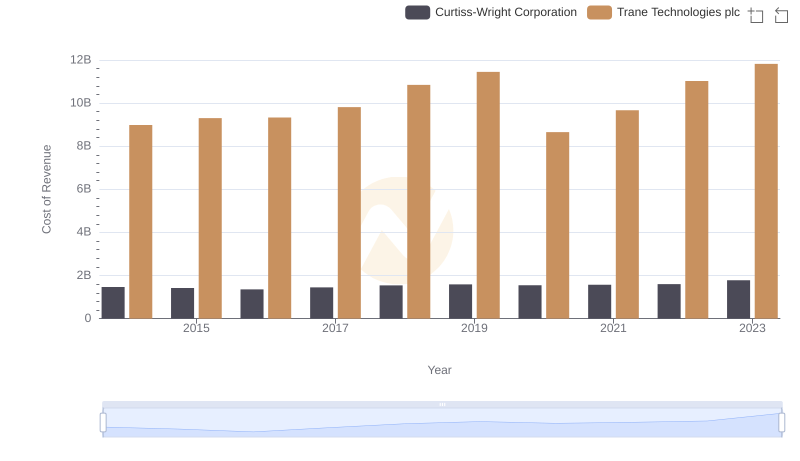
Analyzing Cost of Revenue: Trane Technologies plc and Curtiss-Wright Corporation
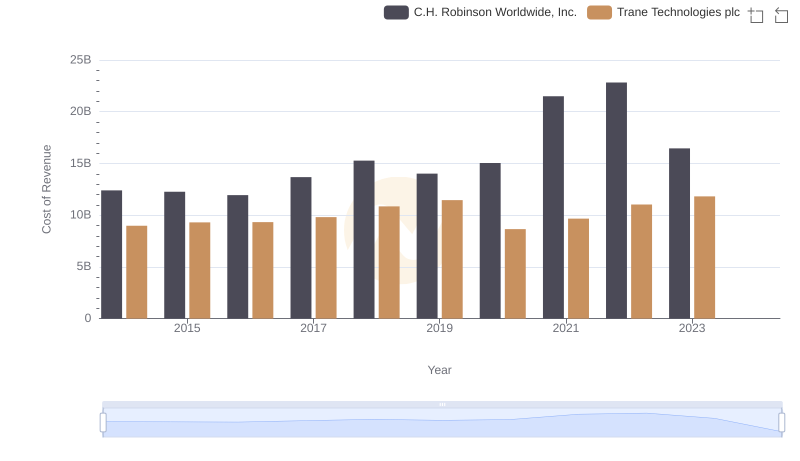
Cost of Revenue Trends: Trane Technologies plc vs C.H. Robinson Worldwide, Inc.
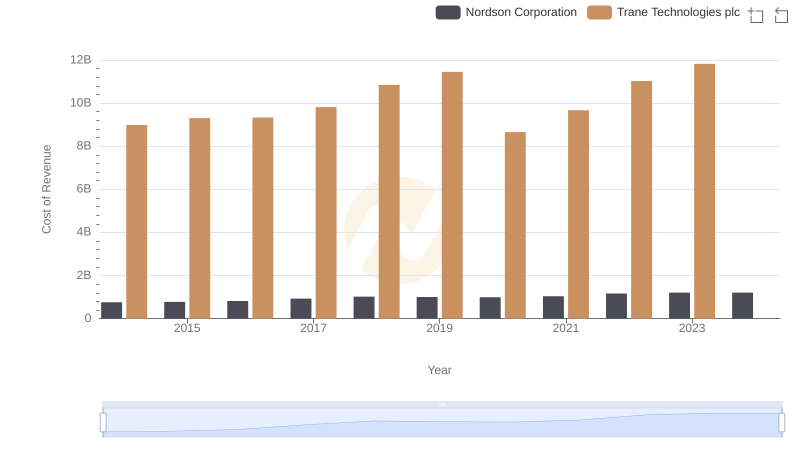
Cost of Revenue: Key Insights for Trane Technologies plc and Nordson Corporation
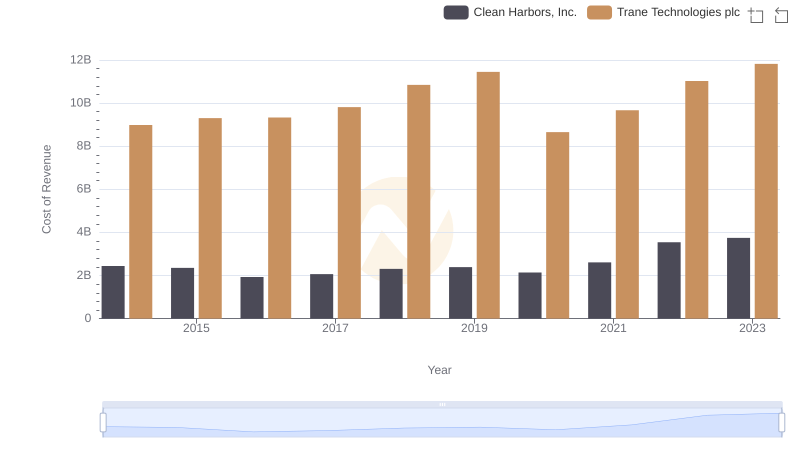
Cost Insights: Breaking Down Trane Technologies plc and Clean Harbors, Inc.'s Expenses

Trane Technologies plc vs TFI International Inc.: Examining Key Revenue Metrics
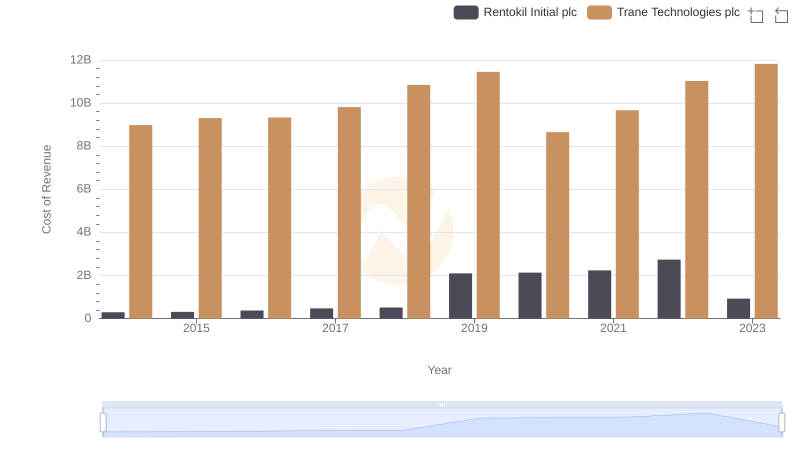
Trane Technologies plc vs Rentokil Initial plc: Efficiency in Cost of Revenue Explored
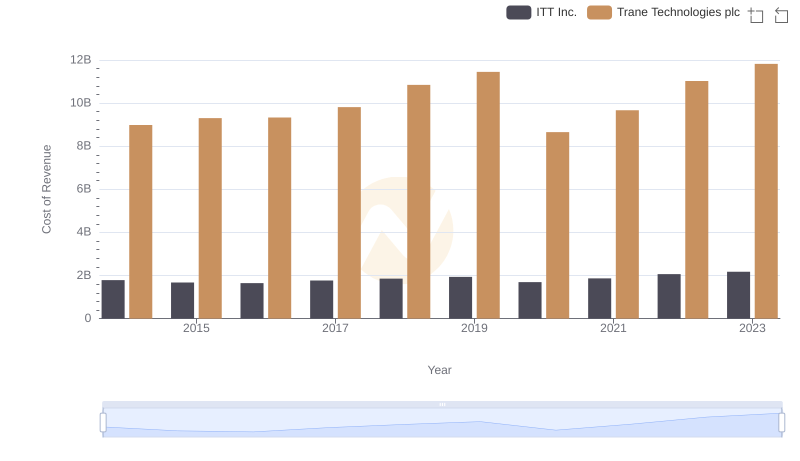
Cost of Revenue: Key Insights for Trane Technologies plc and ITT Inc.
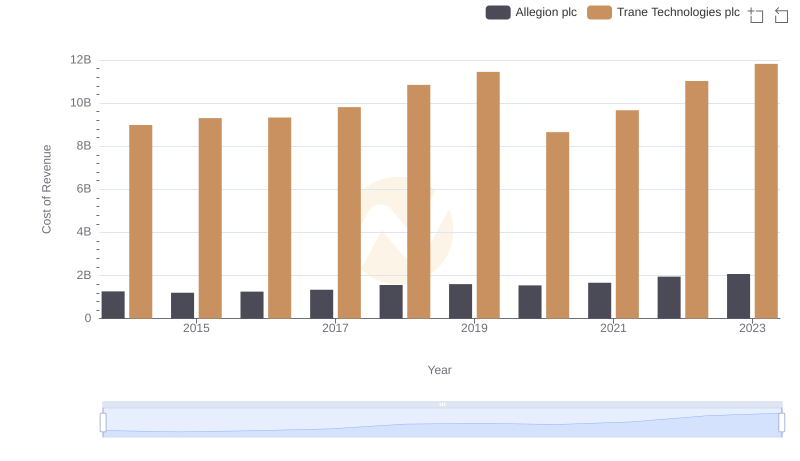
Cost of Revenue: Key Insights for Trane Technologies plc and Allegion plc
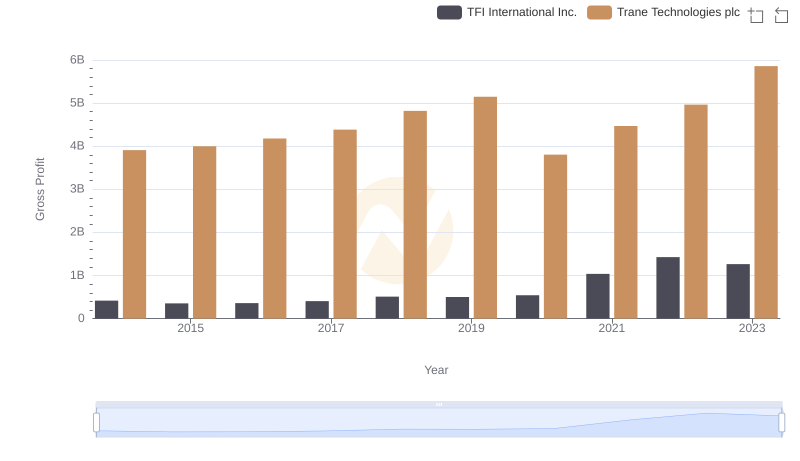
Trane Technologies plc vs TFI International Inc.: A Gross Profit Performance Breakdown
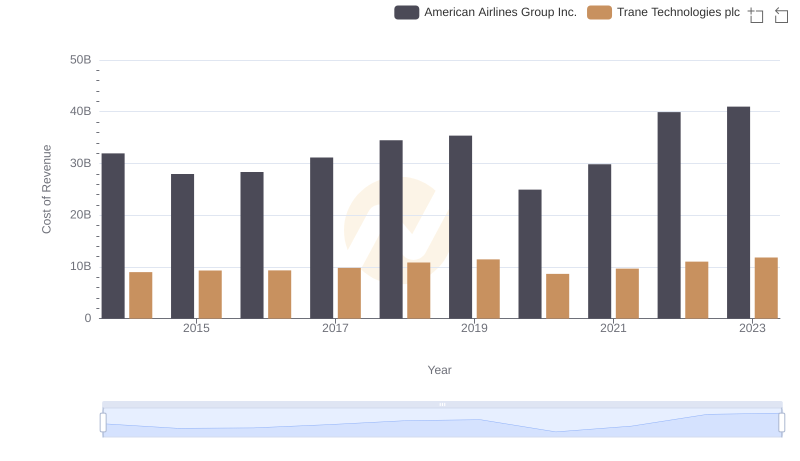
Analyzing Cost of Revenue: Trane Technologies plc and American Airlines Group Inc.
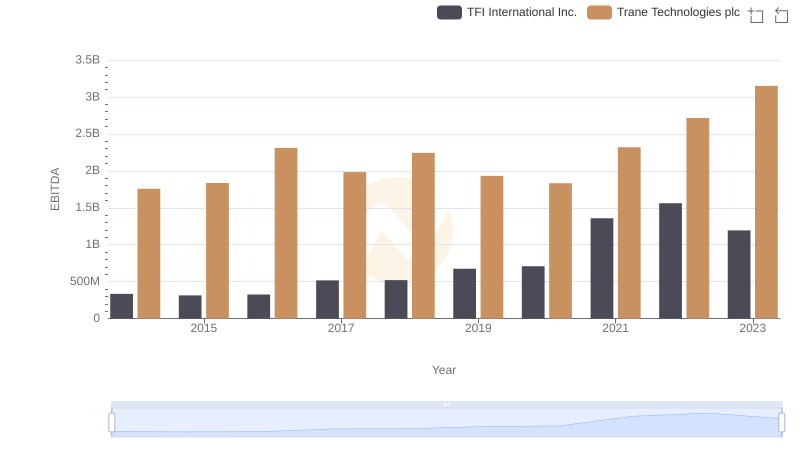
Comprehensive EBITDA Comparison: Trane Technologies plc vs TFI International Inc.