| __timestamp | Rentokil Initial plc | Trane Technologies plc |
|---|---|---|
| Wednesday, January 1, 2014 | 297500000 | 8982800000 |
| Thursday, January 1, 2015 | 310200000 | 9301600000 |
| Friday, January 1, 2016 | 376100000 | 9329300000 |
| Sunday, January 1, 2017 | 474900000 | 9811600000 |
| Monday, January 1, 2018 | 514200000 | 10847600000 |
| Tuesday, January 1, 2019 | 2099000000 | 11451500000 |
| Wednesday, January 1, 2020 | 2136400000 | 8651300000 |
| Friday, January 1, 2021 | 2239100000 | 9666800000 |
| Saturday, January 1, 2022 | 2737000000 | 11026900000 |
| Sunday, January 1, 2023 | 927000000 | 11820400000 |
| Monday, January 1, 2024 | 12757700000 |
Unleashing the power of data
In the ever-evolving landscape of global business, cost efficiency remains a pivotal factor for success. This analysis delves into the cost of revenue trends for Trane Technologies plc and Rentokil Initial plc from 2014 to 2023. Over this period, Trane Technologies consistently demonstrated a robust cost structure, with its cost of revenue peaking at approximately $11.8 billion in 2023, marking a 32% increase from 2014. In contrast, Rentokil Initial's cost of revenue showed a more volatile trajectory, with a significant spike in 2022, reaching nearly $2.7 billion, a staggering 820% rise from 2014. This disparity highlights Trane's stable growth and Rentokil's fluctuating cost management strategies. As businesses navigate the complexities of the modern economy, understanding these trends offers valuable insights into strategic financial planning and operational efficiency.
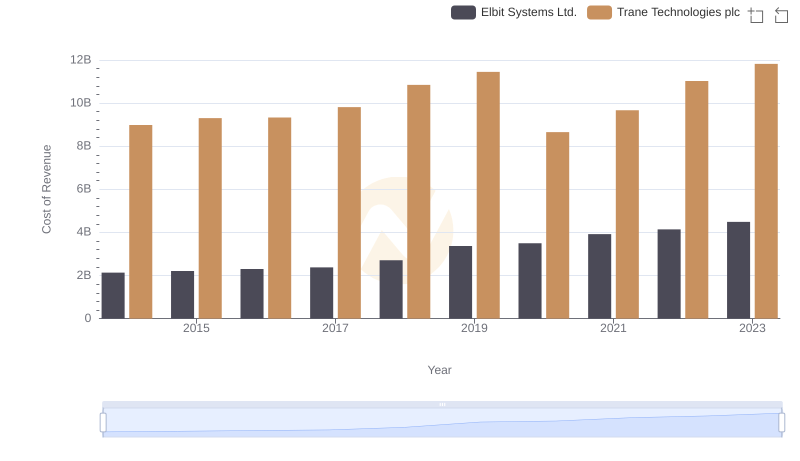
Cost of Revenue Comparison: Trane Technologies plc vs Elbit Systems Ltd.
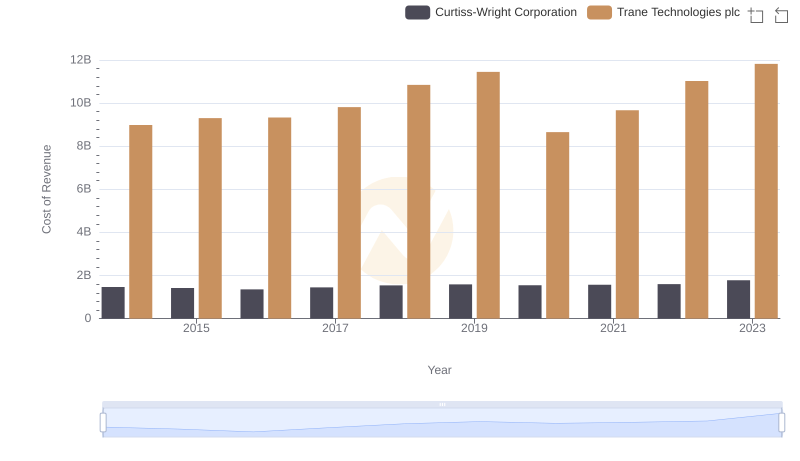
Analyzing Cost of Revenue: Trane Technologies plc and Curtiss-Wright Corporation
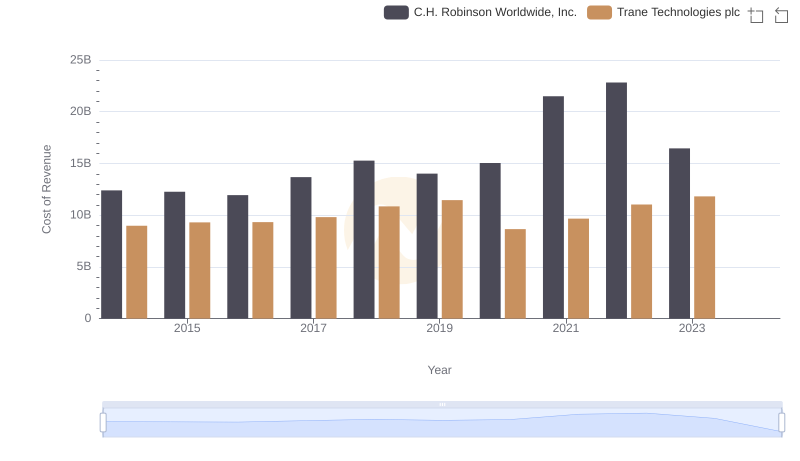
Cost of Revenue Trends: Trane Technologies plc vs C.H. Robinson Worldwide, Inc.
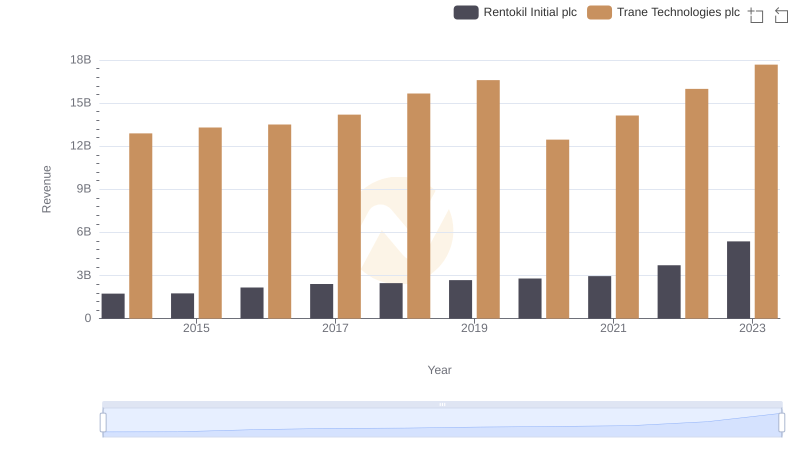
Revenue Showdown: Trane Technologies plc vs Rentokil Initial plc
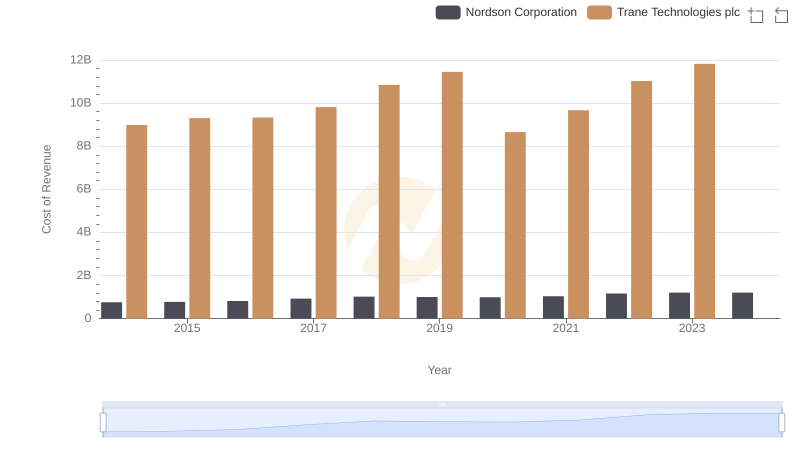
Cost of Revenue: Key Insights for Trane Technologies plc and Nordson Corporation
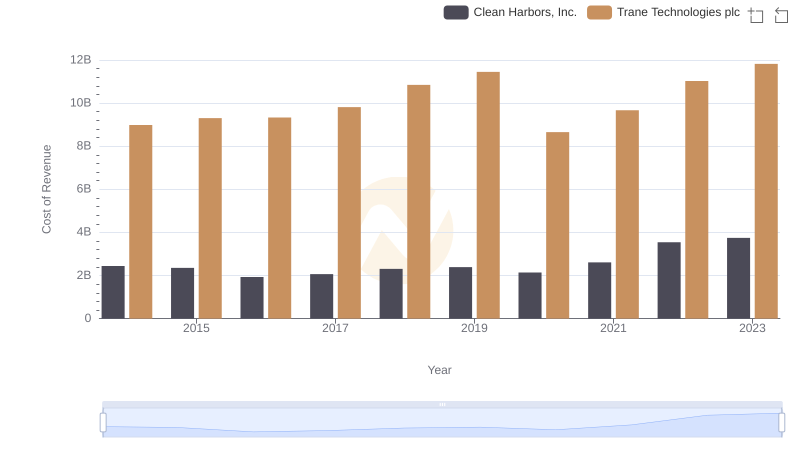
Cost Insights: Breaking Down Trane Technologies plc and Clean Harbors, Inc.'s Expenses
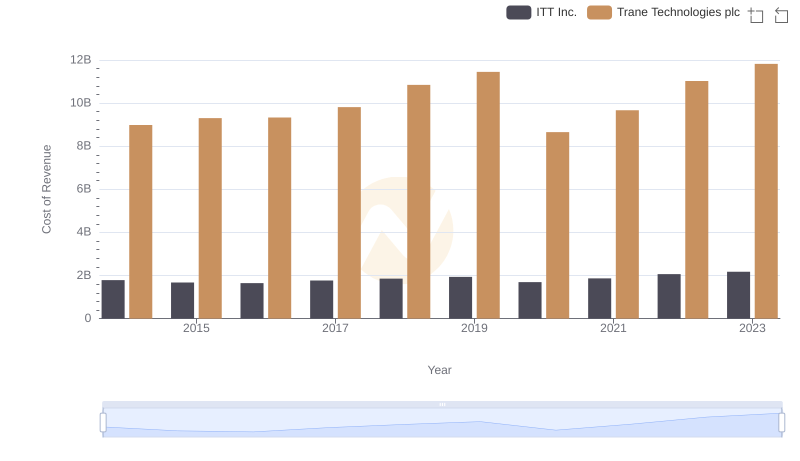
Cost of Revenue: Key Insights for Trane Technologies plc and ITT Inc.
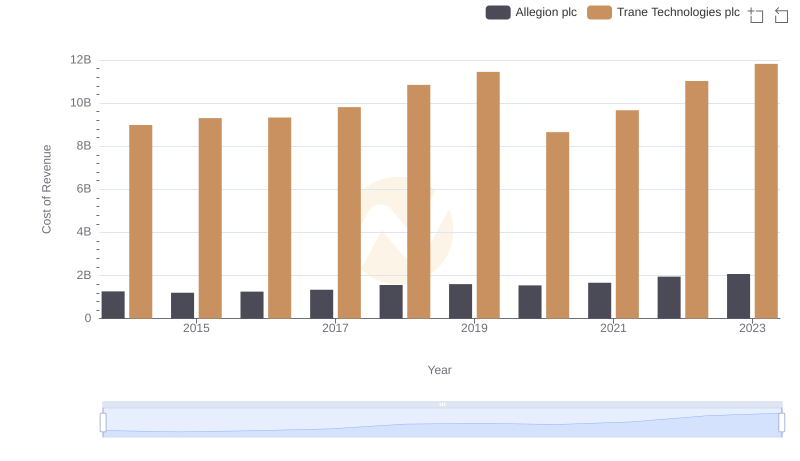
Cost of Revenue: Key Insights for Trane Technologies plc and Allegion plc
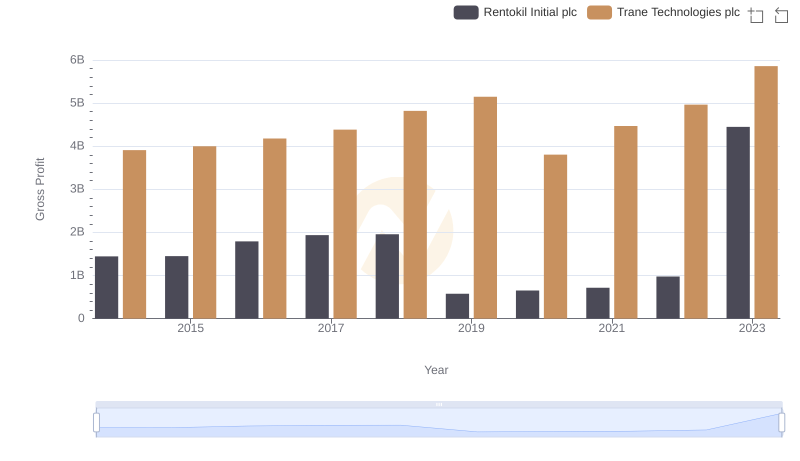
Gross Profit Comparison: Trane Technologies plc and Rentokil Initial plc Trends
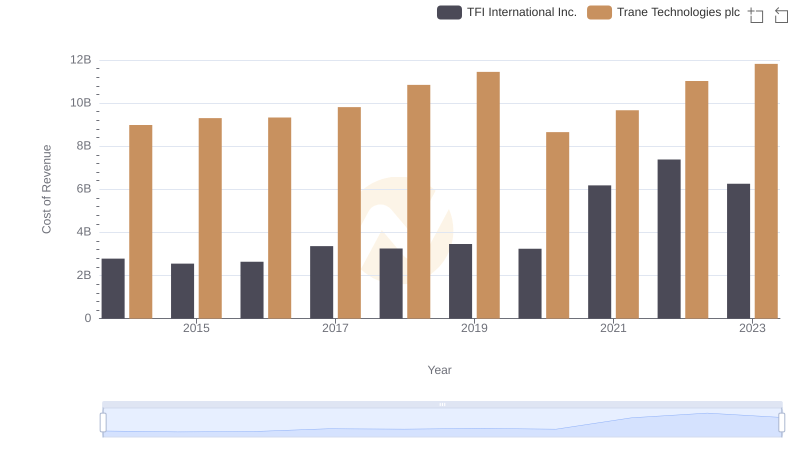
Trane Technologies plc vs TFI International Inc.: Efficiency in Cost of Revenue Explored
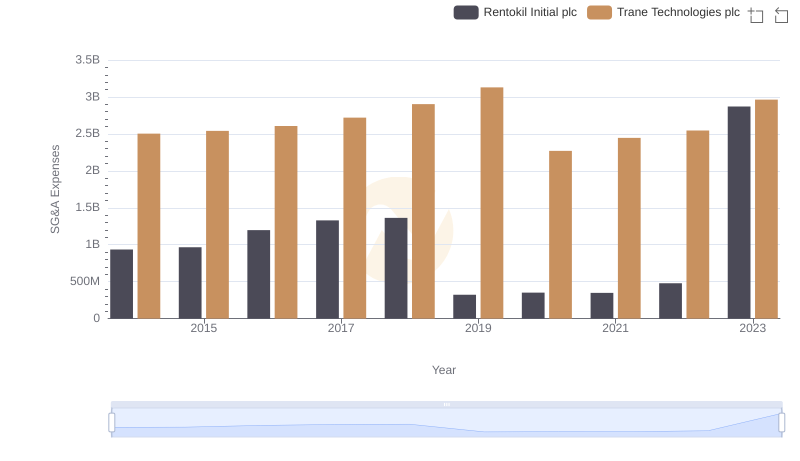
Cost Management Insights: SG&A Expenses for Trane Technologies plc and Rentokil Initial plc
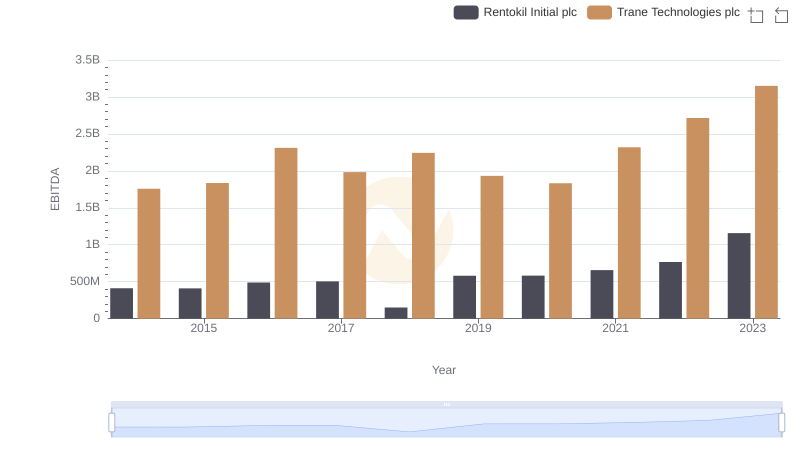
EBITDA Performance Review: Trane Technologies plc vs Rentokil Initial plc