| __timestamp | The Trade Desk, Inc. | Ubiquiti Inc. |
|---|---|---|
| Wednesday, January 1, 2014 | 23975000 | 23560000 |
| Thursday, January 1, 2015 | 40070000 | 21607000 |
| Friday, January 1, 2016 | 78219000 | 33269000 |
| Sunday, January 1, 2017 | 119825000 | 36853000 |
| Monday, January 1, 2018 | 171981000 | 43121000 |
| Tuesday, January 1, 2019 | 275930000 | 43237000 |
| Wednesday, January 1, 2020 | 346359000 | 40569000 |
| Friday, January 1, 2021 | 623959000 | 53513000 |
| Saturday, January 1, 2022 | 863142000 | 69859000 |
| Sunday, January 1, 2023 | 968248000 | 70993000 |
| Monday, January 1, 2024 | 1082333000 | 80997000 |
Unleashing the power of data
In the dynamic world of technology, understanding a company's operational efficiency is crucial. The Trade Desk, Inc. and Ubiquiti Inc. offer a fascinating study in contrasts when it comes to Selling, General, and Administrative (SG&A) expenses. Over the past decade, The Trade Desk has seen a staggering increase in SG&A expenses, growing from approximately $24 million in 2014 to nearly $968 million in 2023. This represents a growth of over 3,900%, reflecting their aggressive expansion strategy. In contrast, Ubiquiti Inc. has maintained a more conservative approach, with SG&A expenses increasing by about 200% from $24 million in 2014 to $71 million in 2023. This divergence highlights different strategic priorities: The Trade Desk's focus on rapid growth versus Ubiquiti's emphasis on operational efficiency. As we look to the future, these trends may offer insights into each company's long-term sustainability and market positioning.
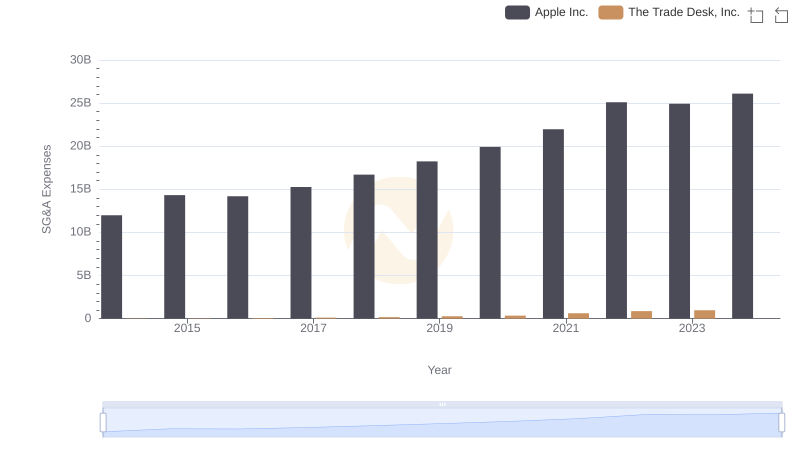
Who Optimizes SG&A Costs Better? Apple Inc. or The Trade Desk, Inc.
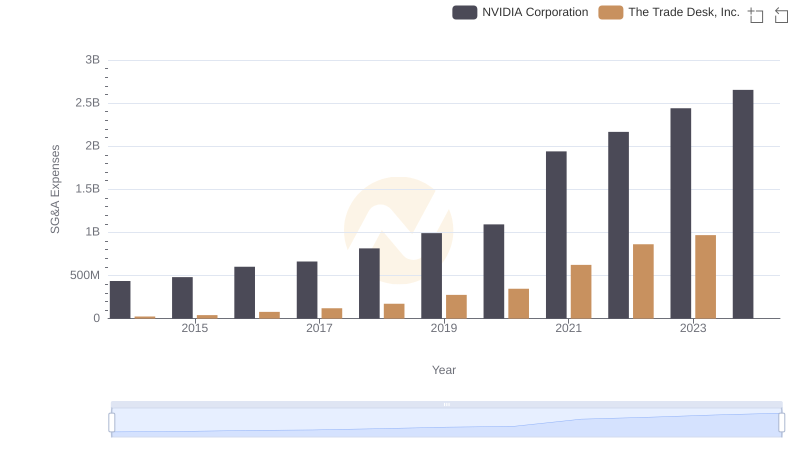
Who Optimizes SG&A Costs Better? NVIDIA Corporation or The Trade Desk, Inc.
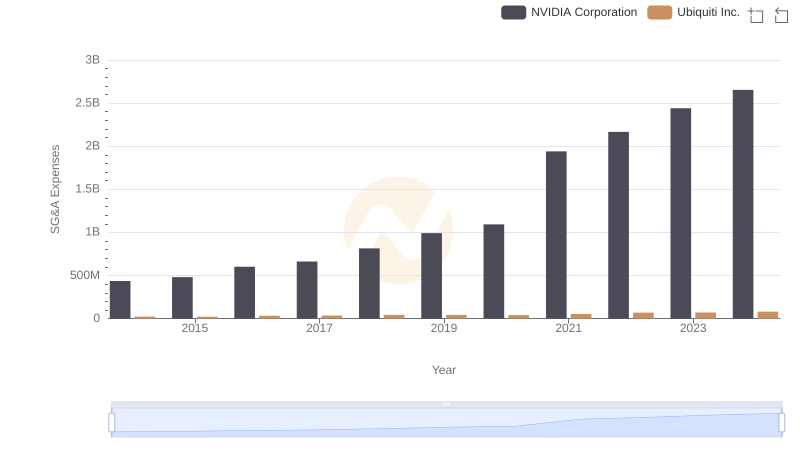
NVIDIA Corporation and Ubiquiti Inc.: SG&A Spending Patterns Compared
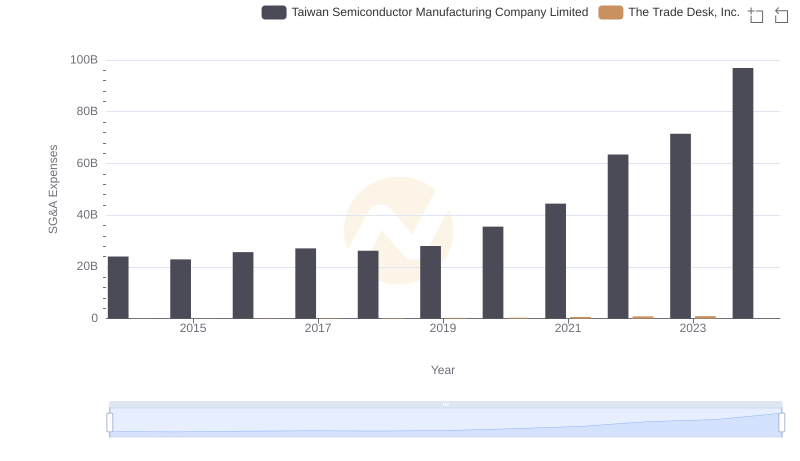
Taiwan Semiconductor Manufacturing Company Limited or The Trade Desk, Inc.: Who Manages SG&A Costs Better?
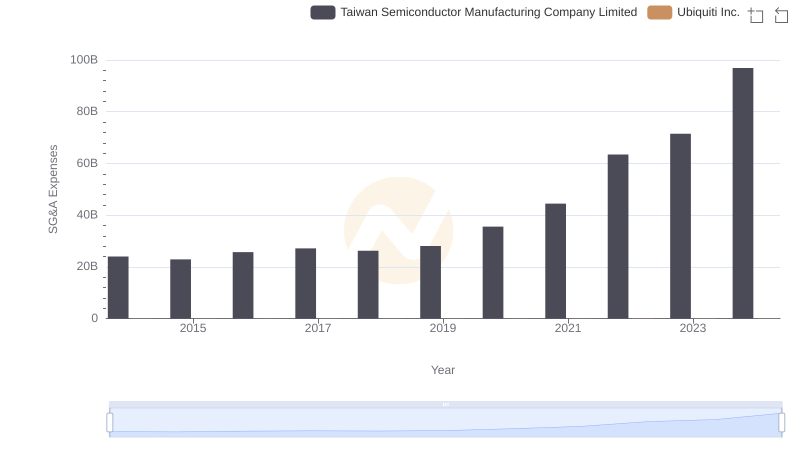
Taiwan Semiconductor Manufacturing Company Limited or Ubiquiti Inc.: Who Manages SG&A Costs Better?
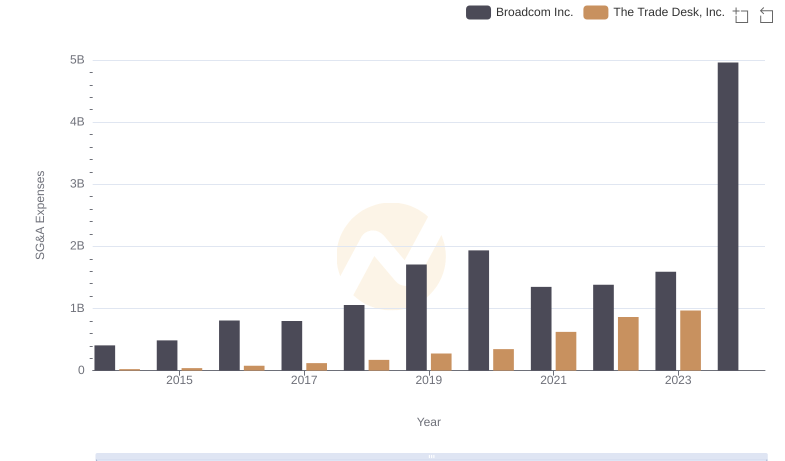
Broadcom Inc. or The Trade Desk, Inc.: Who Manages SG&A Costs Better?
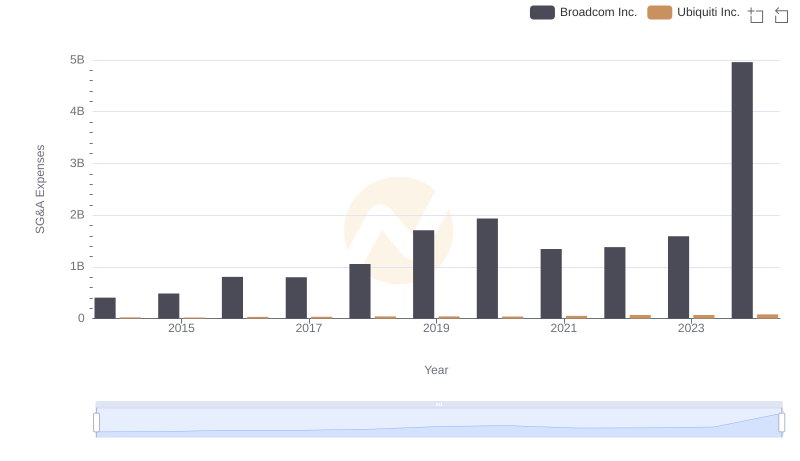
Comparing SG&A Expenses: Broadcom Inc. vs Ubiquiti Inc. Trends and Insights
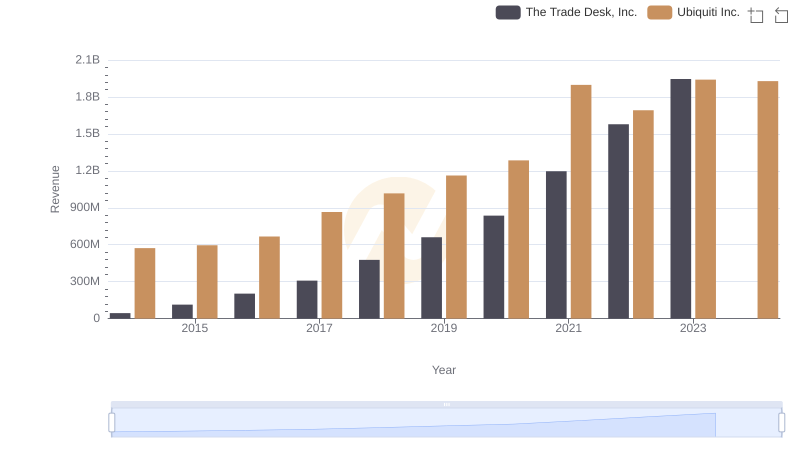
The Trade Desk, Inc. or Ubiquiti Inc.: Who Leads in Yearly Revenue?
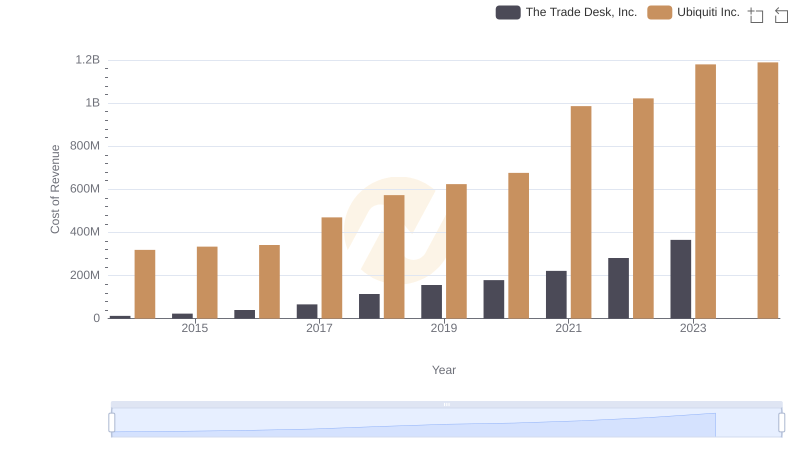
Cost of Revenue: Key Insights for The Trade Desk, Inc. and Ubiquiti Inc.
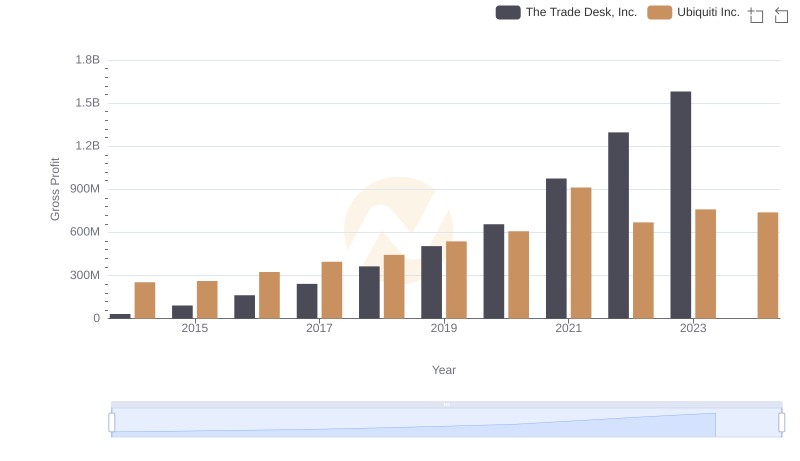
Gross Profit Analysis: Comparing The Trade Desk, Inc. and Ubiquiti Inc.
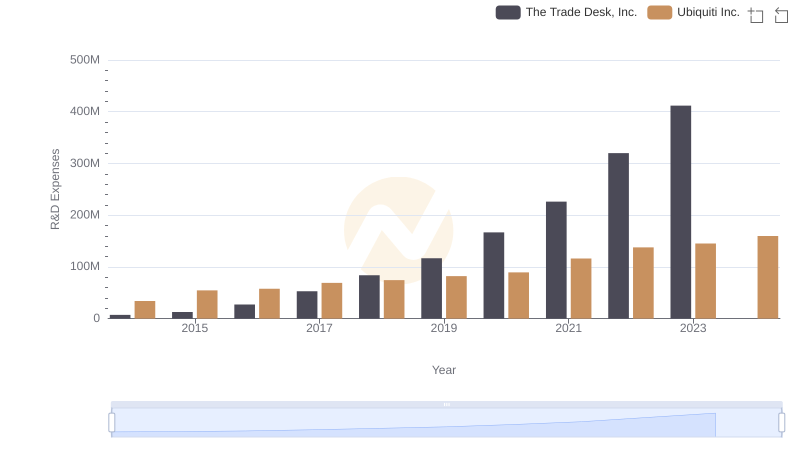
Analyzing R&D Budgets: The Trade Desk, Inc. vs Ubiquiti Inc.
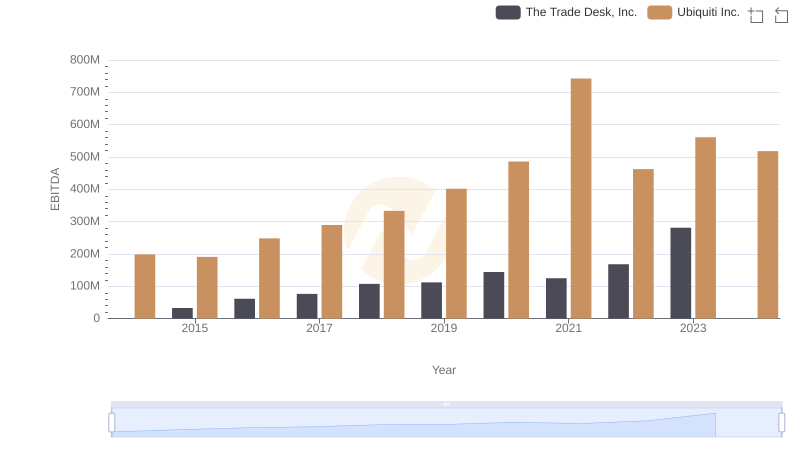
EBITDA Performance Review: The Trade Desk, Inc. vs Ubiquiti Inc.