| __timestamp | The Trade Desk, Inc. | Ubiquiti Inc. |
|---|---|---|
| Wednesday, January 1, 2014 | 7250000 | 33962000 |
| Thursday, January 1, 2015 | 12819000 | 54565000 |
| Friday, January 1, 2016 | 27313000 | 57765000 |
| Sunday, January 1, 2017 | 52806000 | 69094000 |
| Monday, January 1, 2018 | 83892000 | 74324000 |
| Tuesday, January 1, 2019 | 116752000 | 82070000 |
| Wednesday, January 1, 2020 | 166654000 | 89405000 |
| Friday, January 1, 2021 | 226137000 | 116171000 |
| Saturday, January 1, 2022 | 319876000 | 137689000 |
| Sunday, January 1, 2023 | 411794000 | 145172000 |
| Monday, January 1, 2024 | 463319000 | 159768000 |
Infusing magic into the data realm
In the ever-evolving tech landscape, research and development (R&D) investments are pivotal for innovation and growth. This analysis delves into the R&D spending trends of The Trade Desk, Inc. and Ubiquiti Inc. over the past decade.
From 2014 to 2023, The Trade Desk, Inc. has shown a remarkable increase in its R&D budget, growing by over 5,600%. Starting with a modest investment in 2014, the company has consistently ramped up its spending, reaching a peak in 2023. This aggressive investment strategy underscores their commitment to staying at the forefront of digital advertising technology.
Conversely, Ubiquiti Inc. has maintained a more stable R&D expenditure, with a growth of approximately 330% over the same period. Their steady approach reflects a focus on sustaining their position in the networking hardware market.
While The Trade Desk, Inc. data for 2024 is unavailable, Ubiquiti Inc. continues its upward trend, indicating a potential shift in strategy or market conditions.
This comparative analysis highlights the diverse strategies companies employ in R&D to drive innovation and maintain competitive advantage.
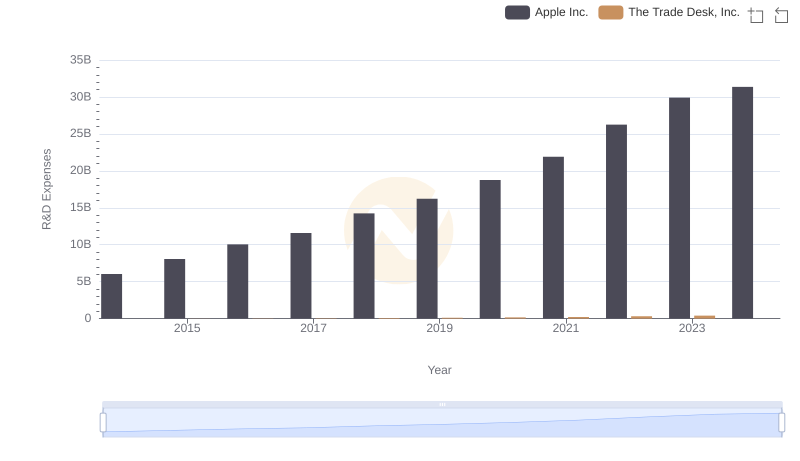
Apple Inc. vs The Trade Desk, Inc.: Strategic Focus on R&D Spending
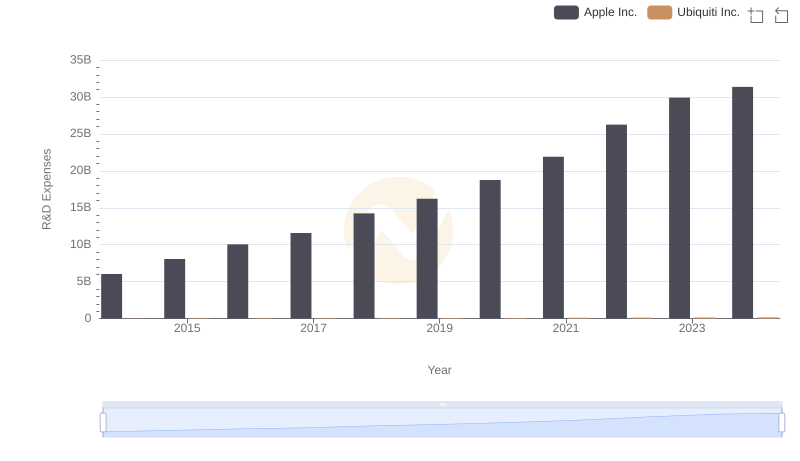
R&D Insights: How Apple Inc. and Ubiquiti Inc. Allocate Funds
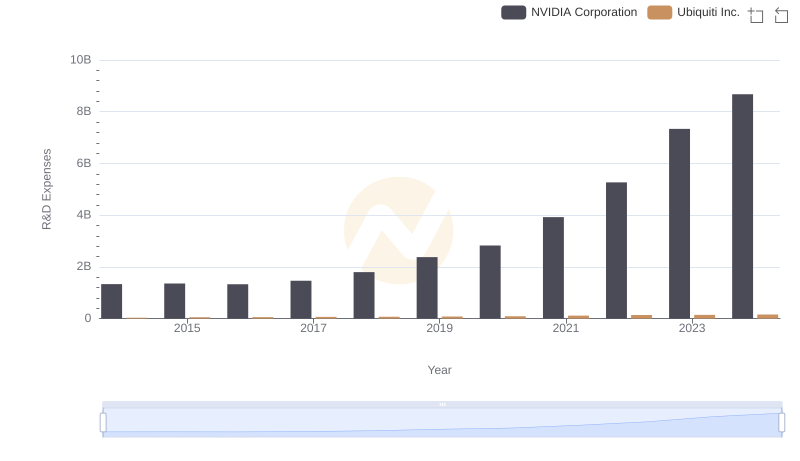
Who Prioritizes Innovation? R&D Spending Compared for NVIDIA Corporation and Ubiquiti Inc.

Taiwan Semiconductor Manufacturing Company Limited or The Trade Desk, Inc.: Who Invests More in Innovation?
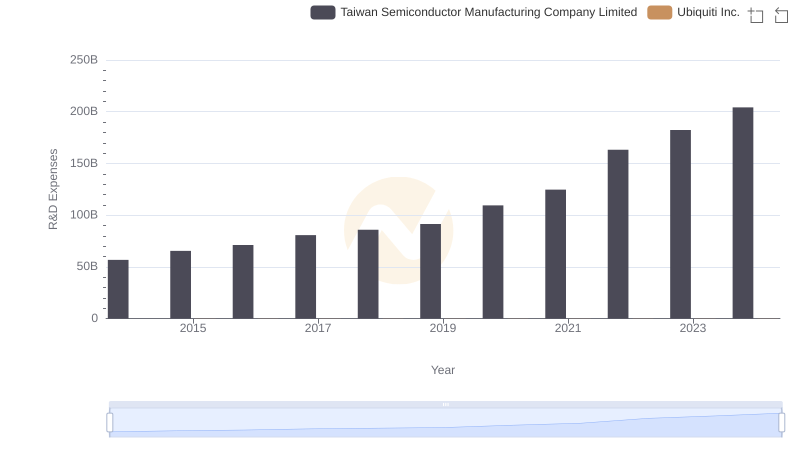
R&D Insights: How Taiwan Semiconductor Manufacturing Company Limited and Ubiquiti Inc. Allocate Funds
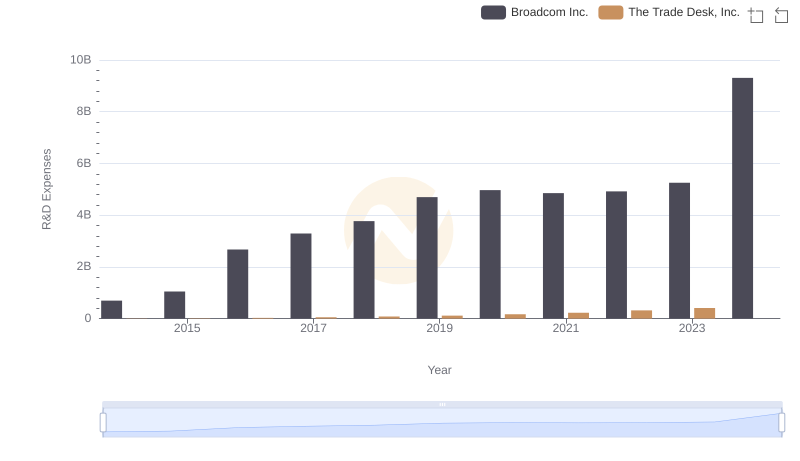
R&D Spending Showdown: Broadcom Inc. vs The Trade Desk, Inc.
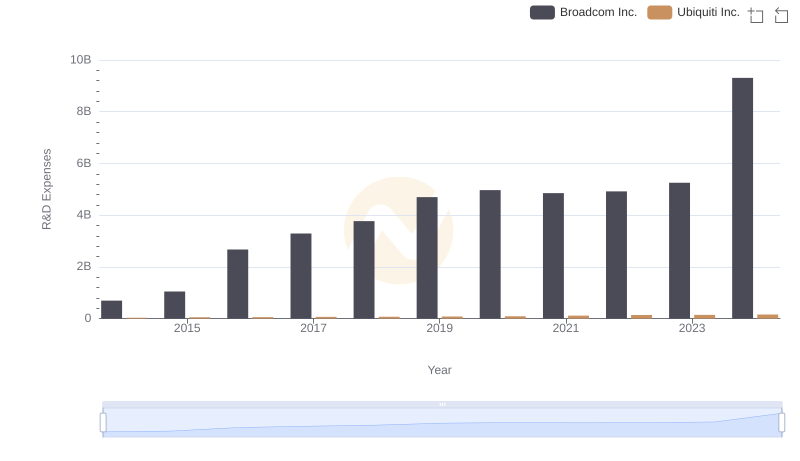
R&D Spending Showdown: Broadcom Inc. vs Ubiquiti Inc.
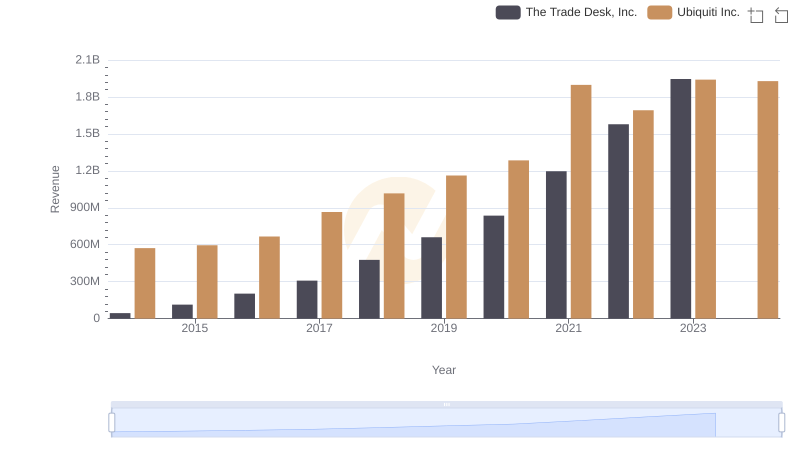
The Trade Desk, Inc. or Ubiquiti Inc.: Who Leads in Yearly Revenue?
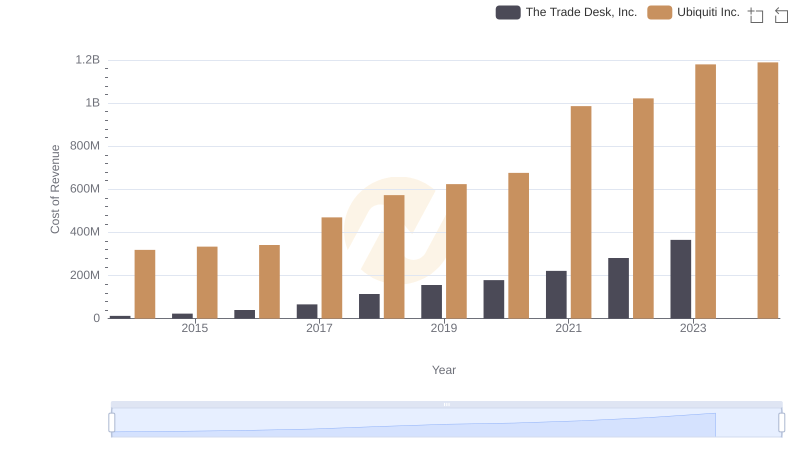
Cost of Revenue: Key Insights for The Trade Desk, Inc. and Ubiquiti Inc.
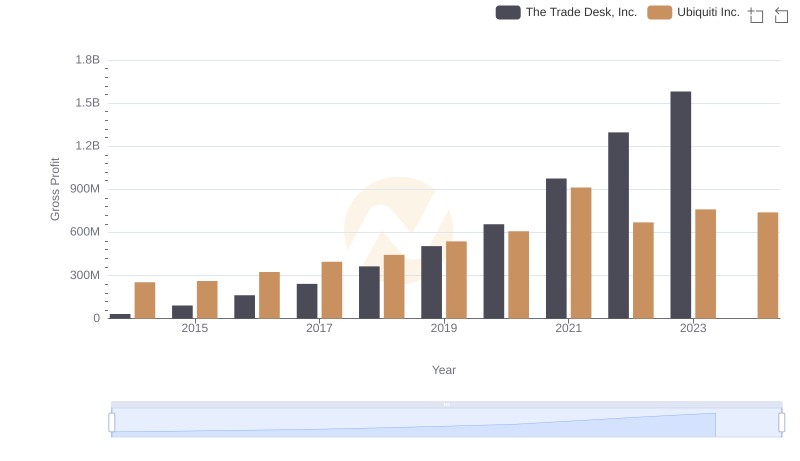
Gross Profit Analysis: Comparing The Trade Desk, Inc. and Ubiquiti Inc.
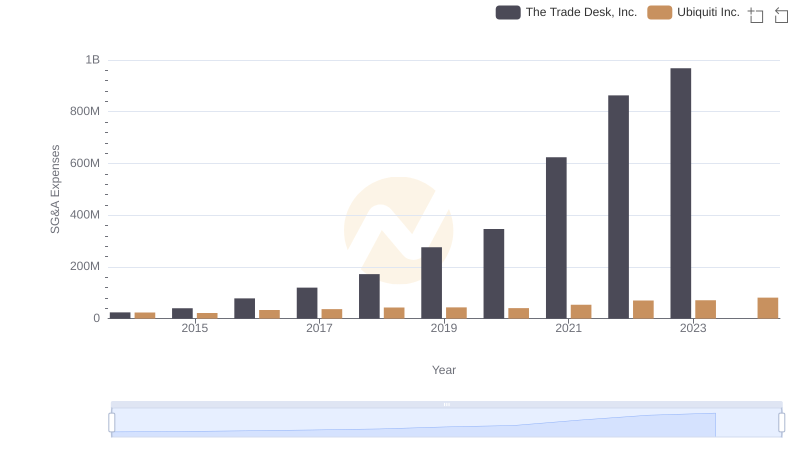
SG&A Efficiency Analysis: Comparing The Trade Desk, Inc. and Ubiquiti Inc.
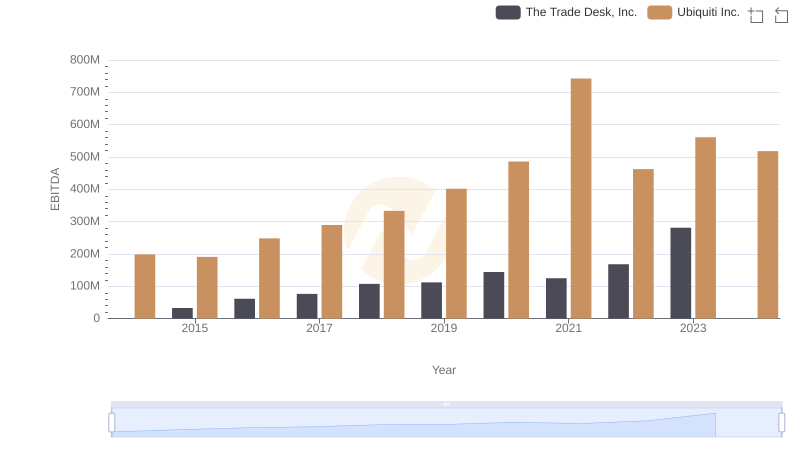
EBITDA Performance Review: The Trade Desk, Inc. vs Ubiquiti Inc.