| __timestamp | The Trade Desk, Inc. | Ubiquiti Inc. |
|---|---|---|
| Wednesday, January 1, 2014 | 31989000 | 253467000 |
| Thursday, January 1, 2015 | 90869000 | 262187000 |
| Friday, January 1, 2016 | 163050000 | 324795000 |
| Sunday, January 1, 2017 | 241987000 | 395708000 |
| Monday, January 1, 2018 | 363196000 | 443572000 |
| Tuesday, January 1, 2019 | 504878000 | 537604000 |
| Wednesday, January 1, 2020 | 657221000 | 608172000 |
| Friday, January 1, 2021 | 974913000 | 912276000 |
| Saturday, January 1, 2022 | 1296672000 | 669812000 |
| Sunday, January 1, 2023 | 1580522000 | 760731000 |
| Monday, January 1, 2024 | 1972819000 | 739762000 |
Data in motion
In the dynamic world of technology, The Trade Desk, Inc. and Ubiquiti Inc. have emerged as significant players, each carving out a unique niche. Over the past decade, The Trade Desk has demonstrated a remarkable growth trajectory, with its gross profit surging by over 4,800% from 2014 to 2023. This meteoric rise underscores its innovative approach in the digital advertising space. Meanwhile, Ubiquiti Inc., a leader in networking technology, has shown steady growth, with a 200% increase in gross profit over the same period.
While The Trade Desk's growth has been exponential, Ubiquiti's consistent performance highlights its resilience in a competitive market. Notably, 2021 was a standout year for both companies, with The Trade Desk achieving a 48% increase in gross profit, while Ubiquiti saw a 50% rise. However, data for 2024 is incomplete, leaving room for speculation on future trends.
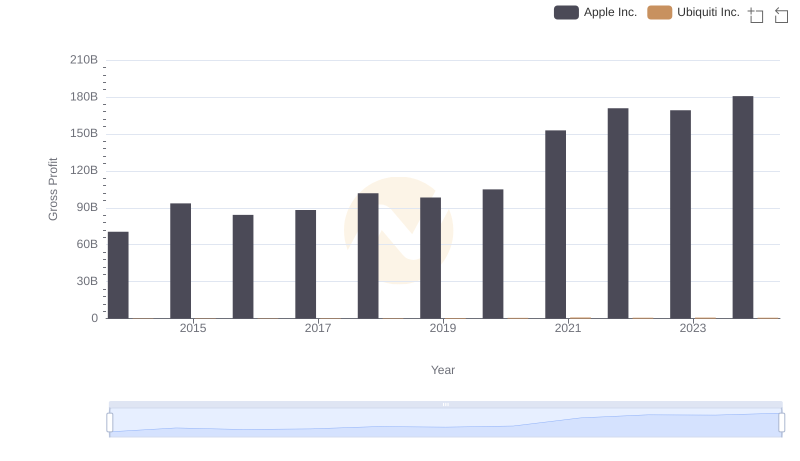
Key Insights on Gross Profit: Apple Inc. vs Ubiquiti Inc.
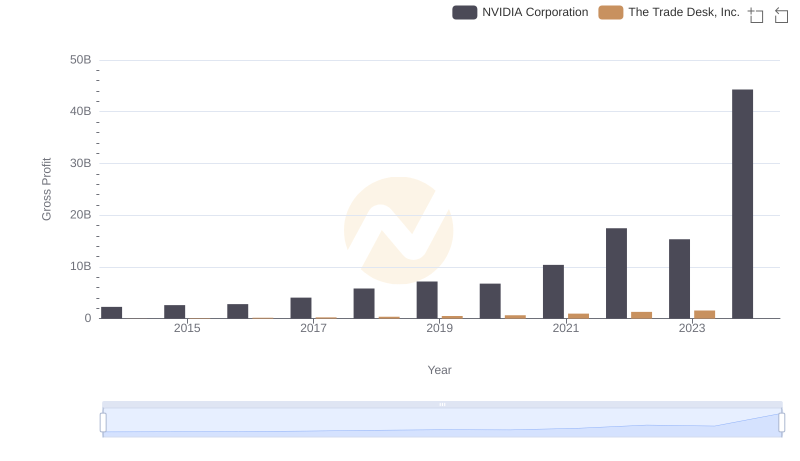
Gross Profit Trends Compared: NVIDIA Corporation vs The Trade Desk, Inc.
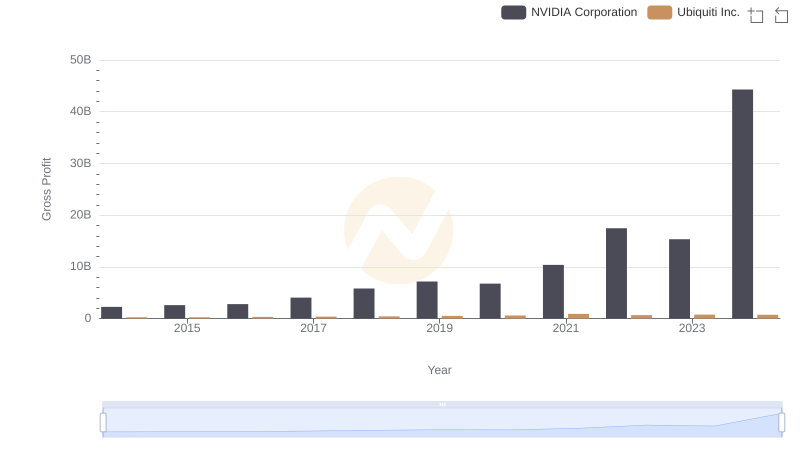
Who Generates Higher Gross Profit? NVIDIA Corporation or Ubiquiti Inc.
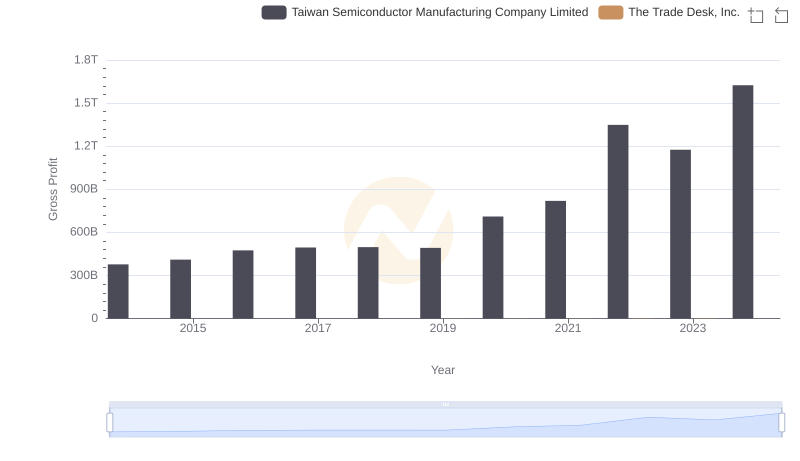
Who Generates Higher Gross Profit? Taiwan Semiconductor Manufacturing Company Limited or The Trade Desk, Inc.
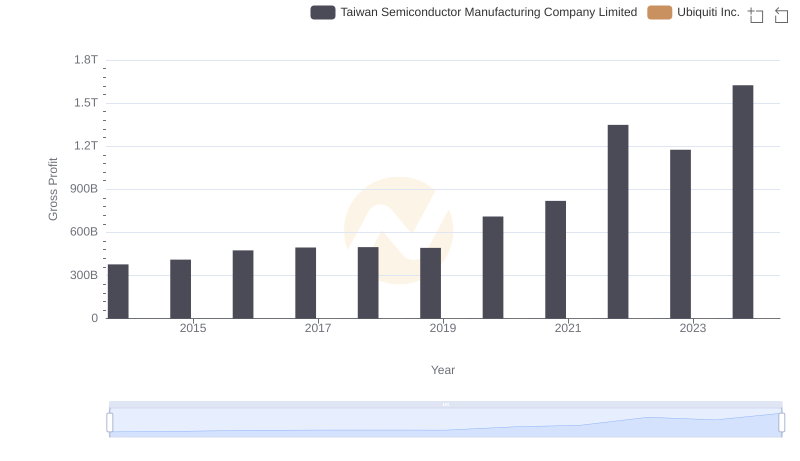
Gross Profit Comparison: Taiwan Semiconductor Manufacturing Company Limited and Ubiquiti Inc. Trends
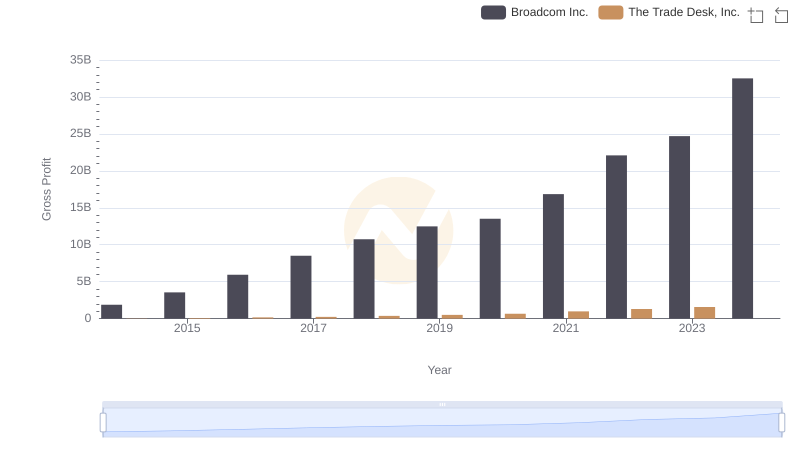
Gross Profit Comparison: Broadcom Inc. and The Trade Desk, Inc. Trends
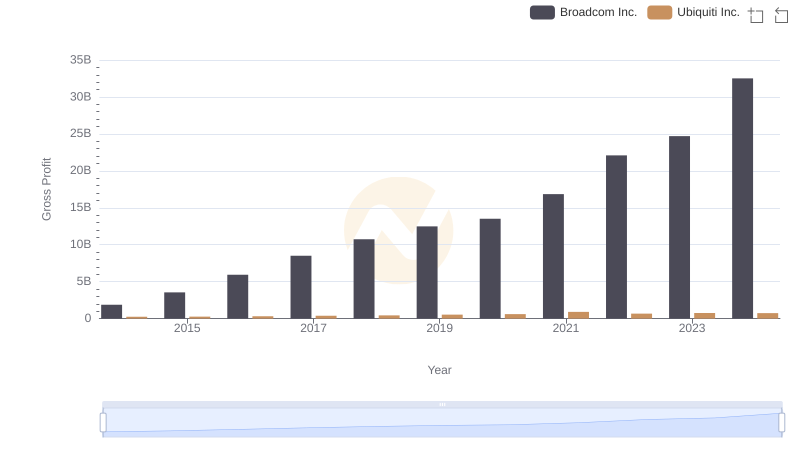
Broadcom Inc. vs Ubiquiti Inc.: A Gross Profit Performance Breakdown
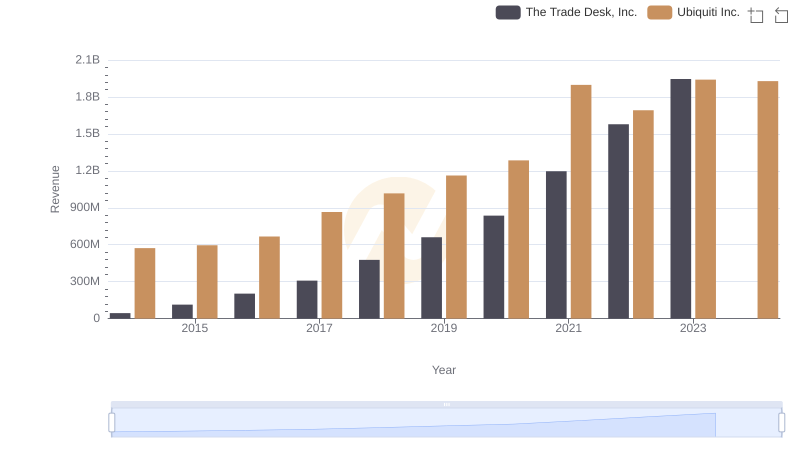
The Trade Desk, Inc. or Ubiquiti Inc.: Who Leads in Yearly Revenue?
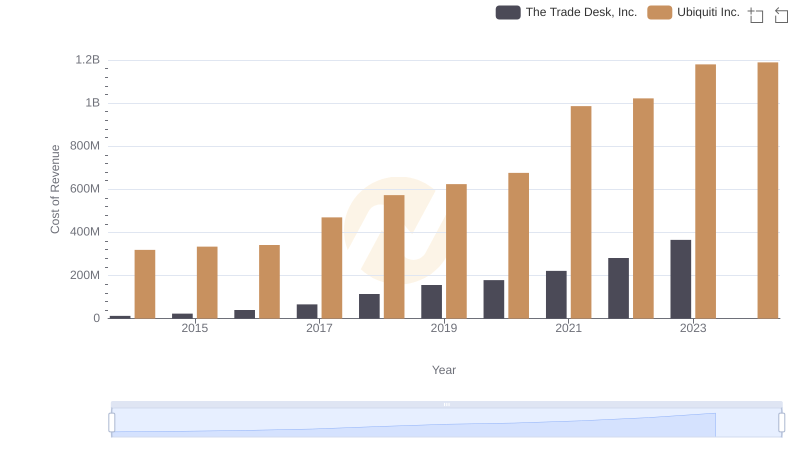
Cost of Revenue: Key Insights for The Trade Desk, Inc. and Ubiquiti Inc.
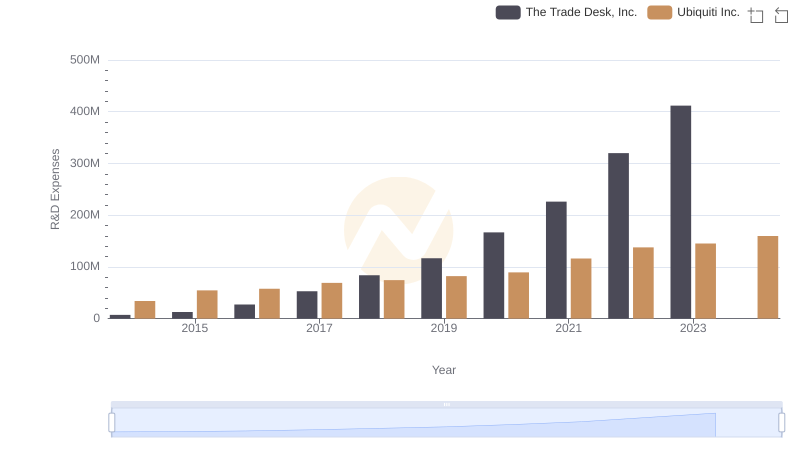
Analyzing R&D Budgets: The Trade Desk, Inc. vs Ubiquiti Inc.
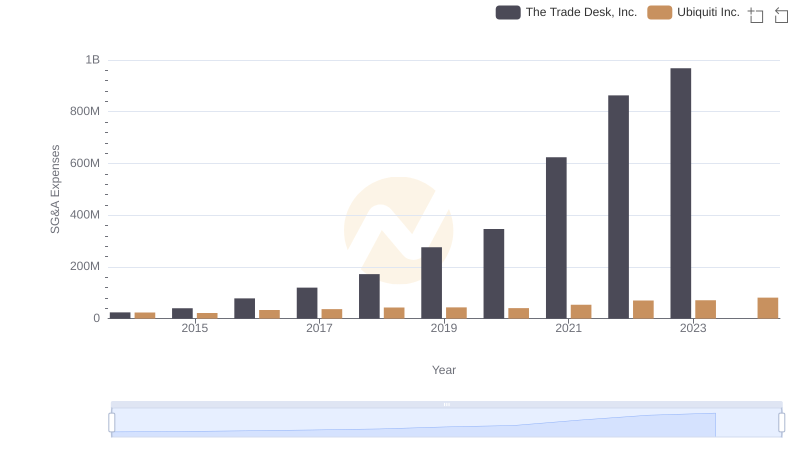
SG&A Efficiency Analysis: Comparing The Trade Desk, Inc. and Ubiquiti Inc.
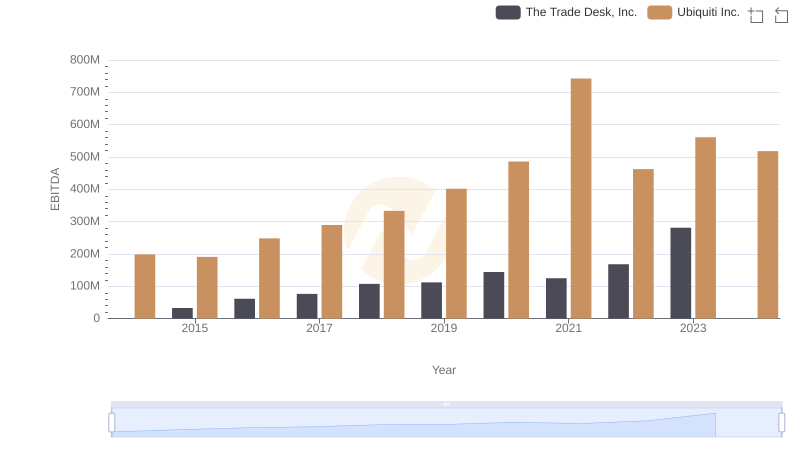
EBITDA Performance Review: The Trade Desk, Inc. vs Ubiquiti Inc.