| __timestamp | The Trade Desk, Inc. | Ubiquiti Inc. |
|---|---|---|
| Wednesday, January 1, 2014 | 12559000 | 318997000 |
| Thursday, January 1, 2015 | 22967000 | 333760000 |
| Friday, January 1, 2016 | 39876000 | 341600000 |
| Sunday, January 1, 2017 | 66230000 | 469560000 |
| Monday, January 1, 2018 | 114098000 | 573289000 |
| Tuesday, January 1, 2019 | 156180000 | 624129000 |
| Wednesday, January 1, 2020 | 178812000 | 676328000 |
| Friday, January 1, 2021 | 221554000 | 985818000 |
| Saturday, January 1, 2022 | 281123000 | 1021880000 |
| Sunday, January 1, 2023 | 365598000 | 1179781000 |
| Monday, January 1, 2024 | 472012000 | 1188728000 |
Igniting the spark of knowledge
In the ever-evolving landscape of digital advertising and networking technology, understanding cost structures is crucial. The Trade Desk, Inc. and Ubiquiti Inc. have shown distinct trajectories in their cost of revenue from 2014 to 2023. The Trade Desk, Inc. has experienced a remarkable growth, with its cost of revenue increasing nearly 29 times over this period, reflecting its expanding market presence and operational scale. In contrast, Ubiquiti Inc. has seen a steady rise, with a 270% increase, indicating robust growth in its networking solutions.
These trends highlight the dynamic nature of these industries and the strategic maneuvers of these companies.

Cost of Revenue Trends: Apple Inc. vs Ubiquiti Inc.
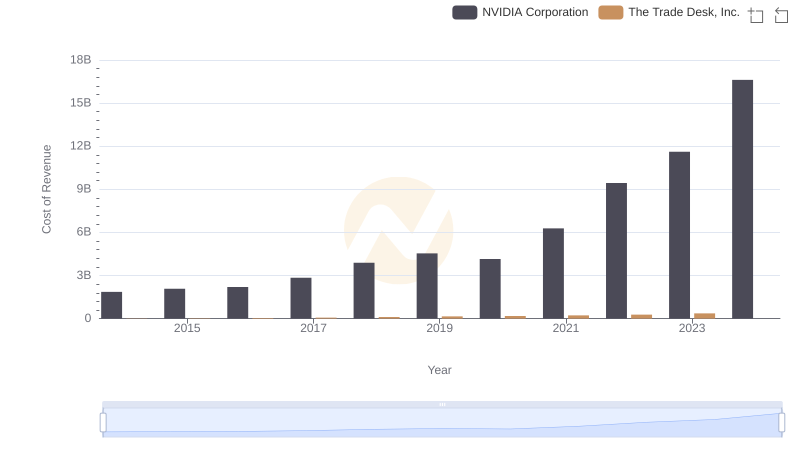
Cost Insights: Breaking Down NVIDIA Corporation and The Trade Desk, Inc.'s Expenses
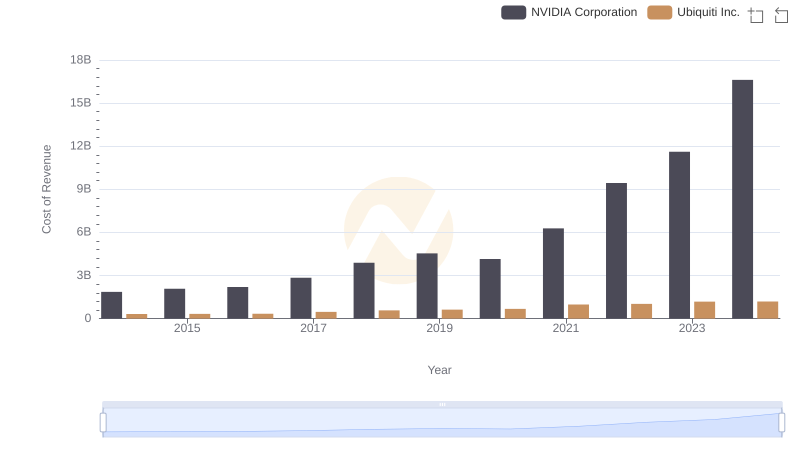
Cost Insights: Breaking Down NVIDIA Corporation and Ubiquiti Inc.'s Expenses
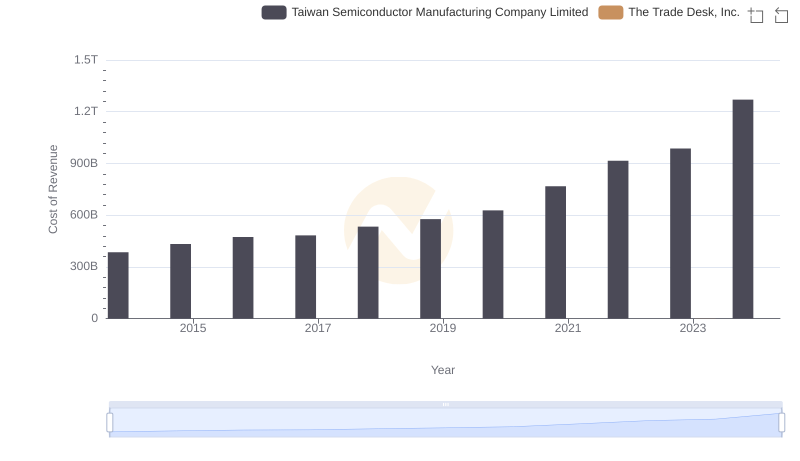
Comparing Cost of Revenue Efficiency: Taiwan Semiconductor Manufacturing Company Limited vs The Trade Desk, Inc.
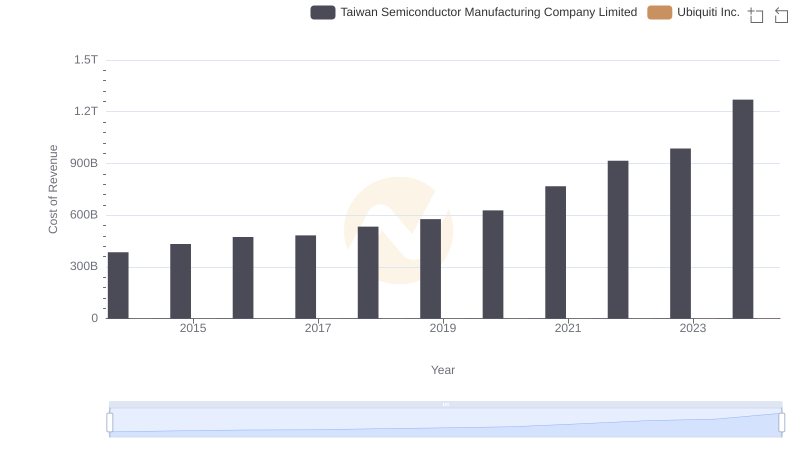
Comparing Cost of Revenue Efficiency: Taiwan Semiconductor Manufacturing Company Limited vs Ubiquiti Inc.
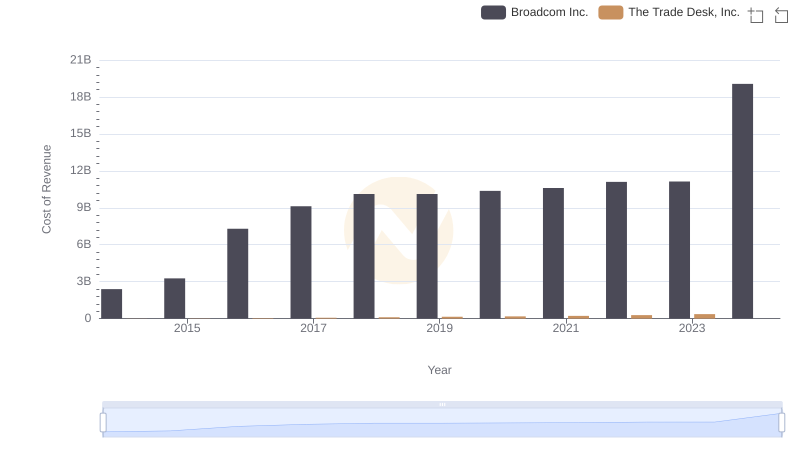
Cost Insights: Breaking Down Broadcom Inc. and The Trade Desk, Inc.'s Expenses
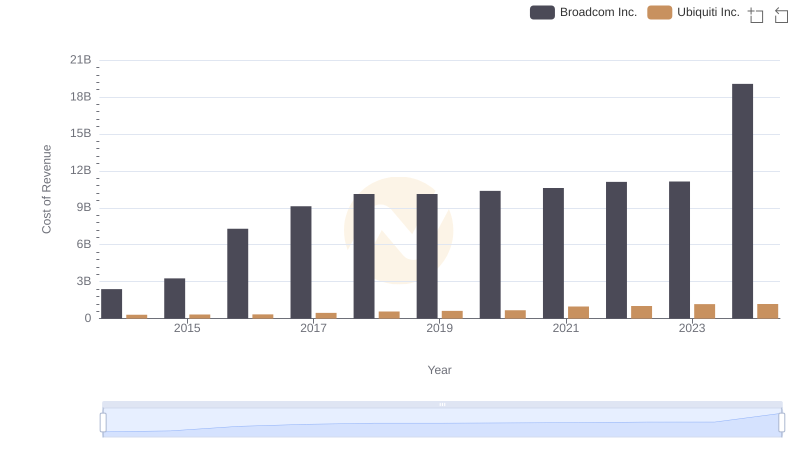
Analyzing Cost of Revenue: Broadcom Inc. and Ubiquiti Inc.
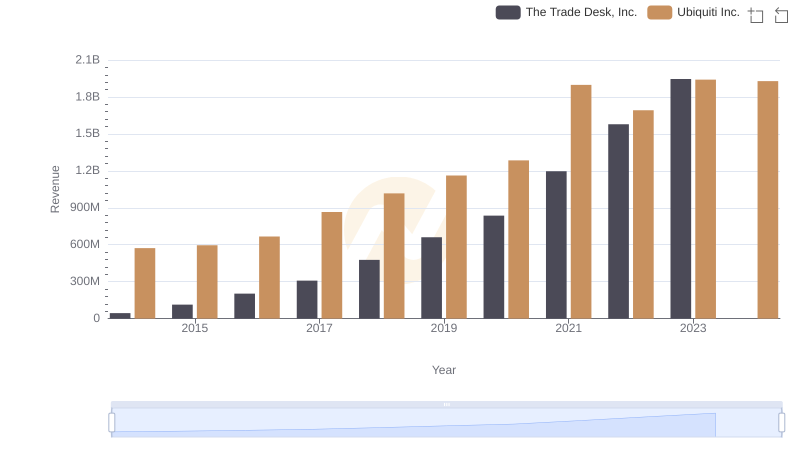
The Trade Desk, Inc. or Ubiquiti Inc.: Who Leads in Yearly Revenue?
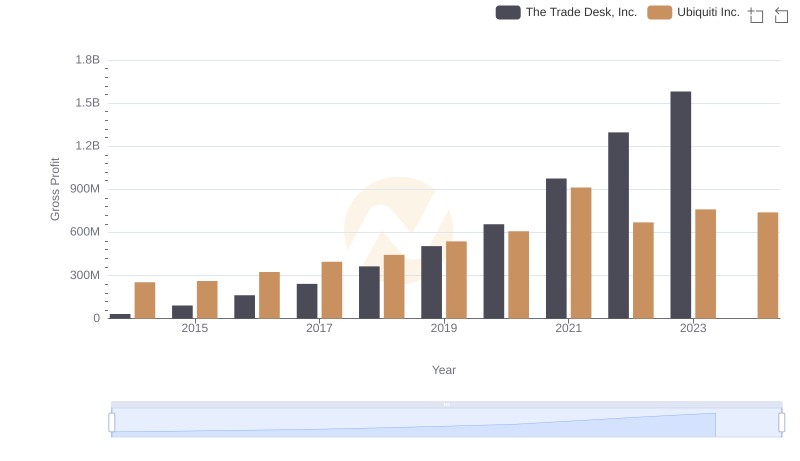
Gross Profit Analysis: Comparing The Trade Desk, Inc. and Ubiquiti Inc.
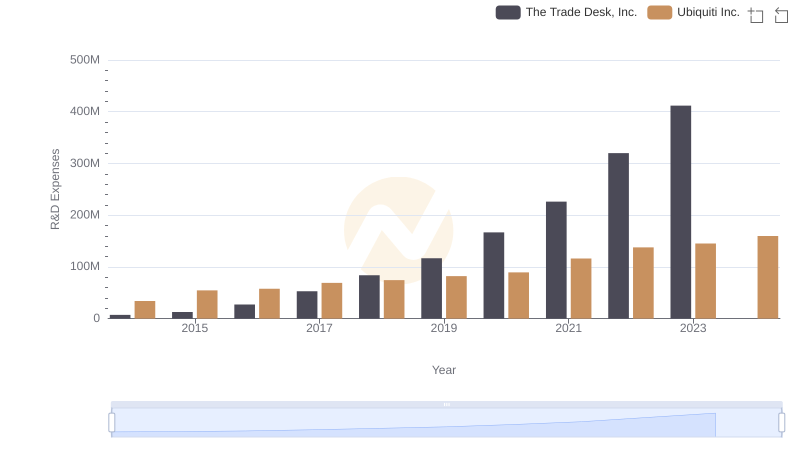
Analyzing R&D Budgets: The Trade Desk, Inc. vs Ubiquiti Inc.
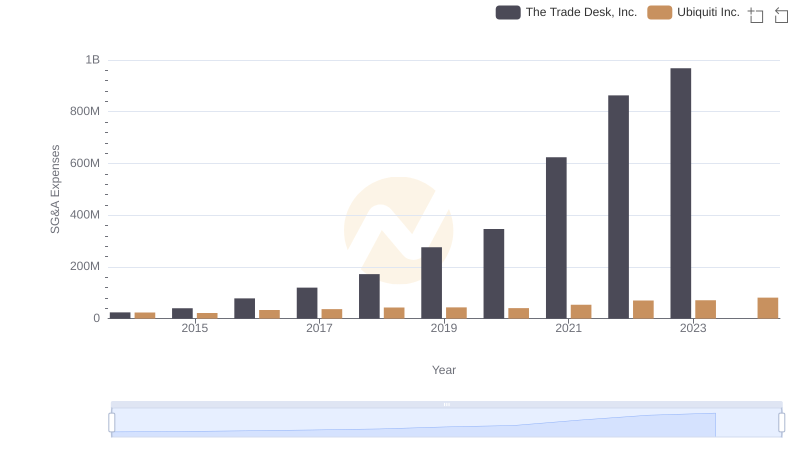
SG&A Efficiency Analysis: Comparing The Trade Desk, Inc. and Ubiquiti Inc.
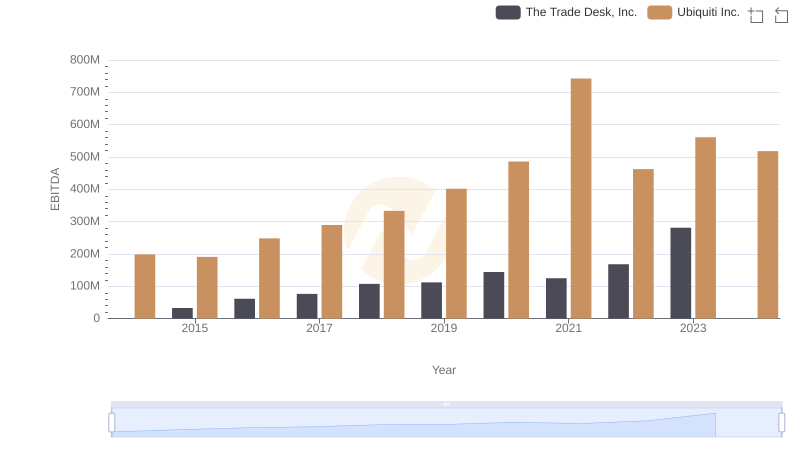
EBITDA Performance Review: The Trade Desk, Inc. vs Ubiquiti Inc.