| __timestamp | The Trade Desk, Inc. | Ubiquiti Inc. |
|---|---|---|
| Wednesday, January 1, 2014 | 580000 | 198764000 |
| Thursday, January 1, 2015 | 32824000 | 190986000 |
| Friday, January 1, 2016 | 61316000 | 248349000 |
| Sunday, January 1, 2017 | 76565000 | 289761000 |
| Monday, January 1, 2018 | 107323000 | 333437000 |
| Tuesday, January 1, 2019 | 112196000 | 401853000 |
| Wednesday, January 1, 2020 | 144208000 | 485893000 |
| Friday, January 1, 2021 | 124817000 | 742592000 |
| Saturday, January 1, 2022 | 168079000 | 462264000 |
| Sunday, January 1, 2023 | 280898000 | 560858000 |
| Monday, January 1, 2024 | 427167000 | 518248000 |
Unveiling the hidden dimensions of data
In the ever-evolving landscape of digital advertising and networking technology, The Trade Desk, Inc. and Ubiquiti Inc. have emerged as key players. Over the past decade, these companies have demonstrated remarkable growth in their EBITDA, a crucial indicator of financial health.
From 2014 to 2023, The Trade Desk, Inc. has seen its EBITDA grow by an impressive 48 times, peaking in 2023. This growth underscores the company's strategic positioning in the digital advertising space, capitalizing on the shift towards programmatic advertising.
Meanwhile, Ubiquiti Inc. has consistently maintained a strong EBITDA, with a 2.8 times increase from 2014 to 2023. The company's focus on innovative networking solutions has solidified its market presence, particularly in the face of increasing demand for reliable connectivity.
Despite missing data for 2024, the trends suggest continued robust performance for both companies.
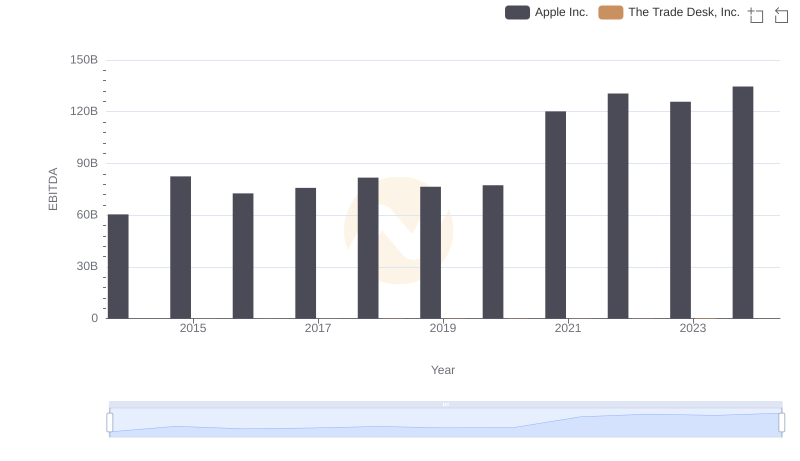
EBITDA Performance Review: Apple Inc. vs The Trade Desk, Inc.
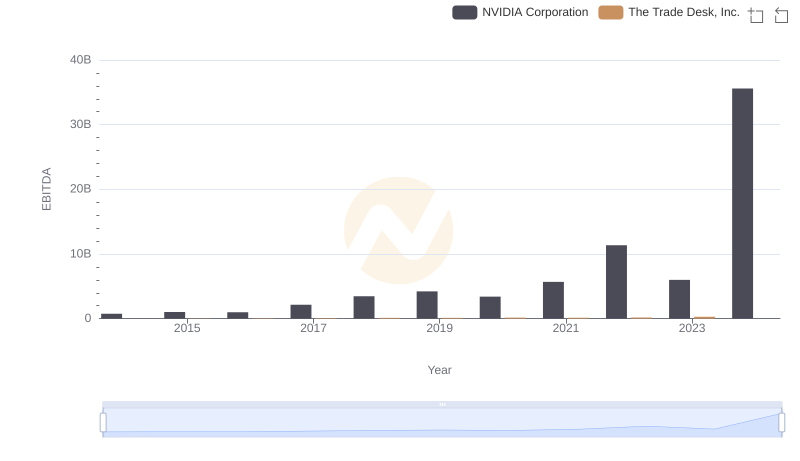
EBITDA Metrics Evaluated: NVIDIA Corporation vs The Trade Desk, Inc.

Professional EBITDA Benchmarking: NVIDIA Corporation vs Ubiquiti Inc.
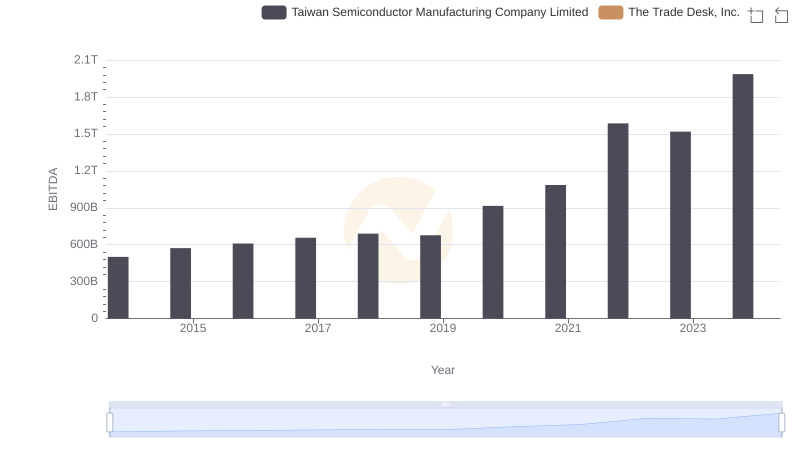
Taiwan Semiconductor Manufacturing Company Limited and The Trade Desk, Inc.: A Detailed Examination of EBITDA Performance
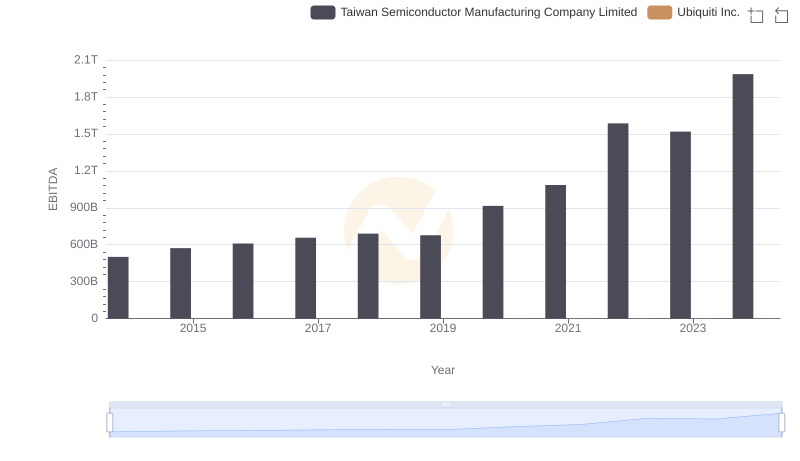
Professional EBITDA Benchmarking: Taiwan Semiconductor Manufacturing Company Limited vs Ubiquiti Inc.
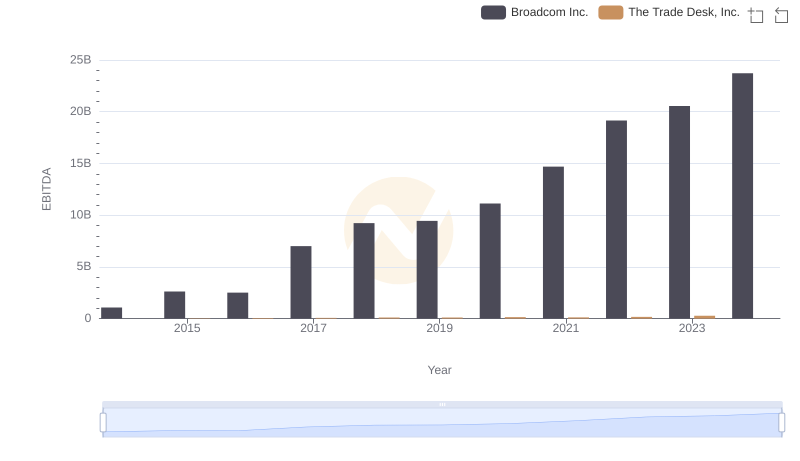
EBITDA Analysis: Evaluating Broadcom Inc. Against The Trade Desk, Inc.
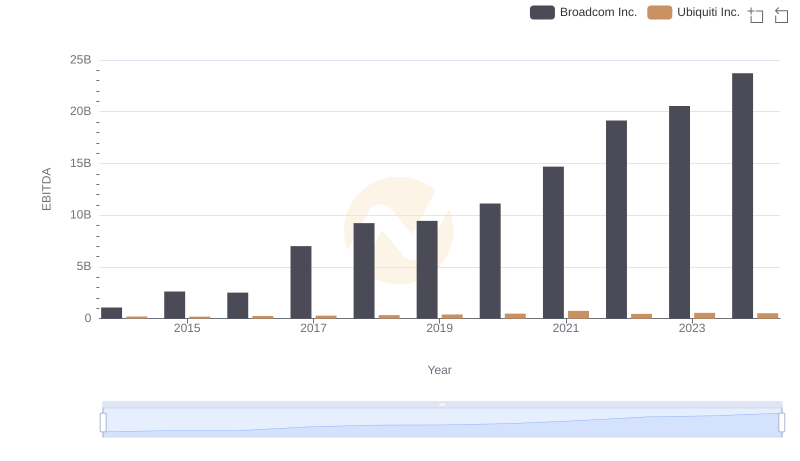
EBITDA Performance Review: Broadcom Inc. vs Ubiquiti Inc.
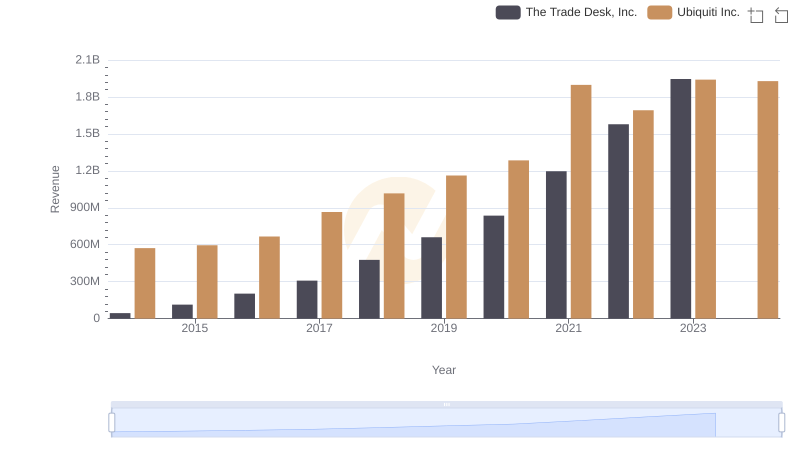
The Trade Desk, Inc. or Ubiquiti Inc.: Who Leads in Yearly Revenue?
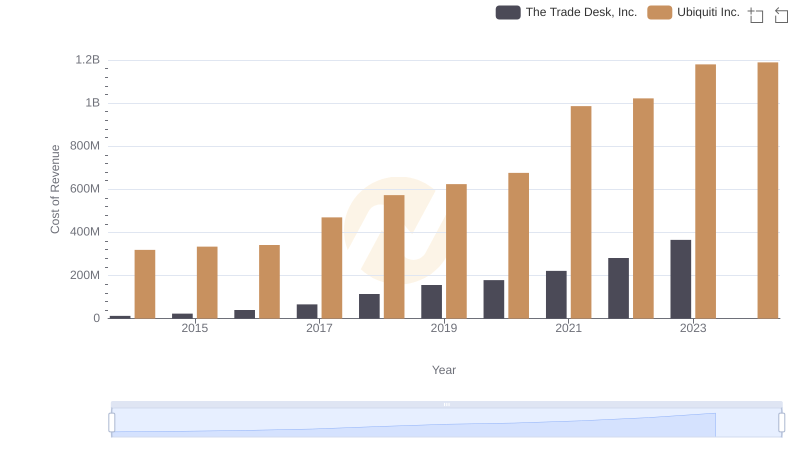
Cost of Revenue: Key Insights for The Trade Desk, Inc. and Ubiquiti Inc.
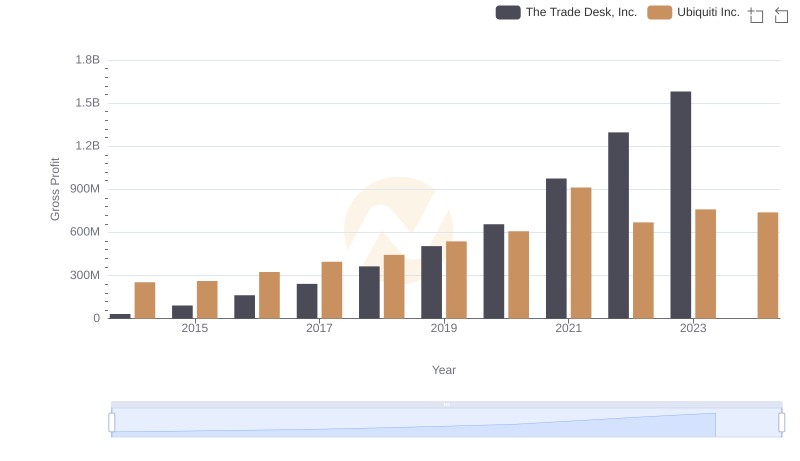
Gross Profit Analysis: Comparing The Trade Desk, Inc. and Ubiquiti Inc.
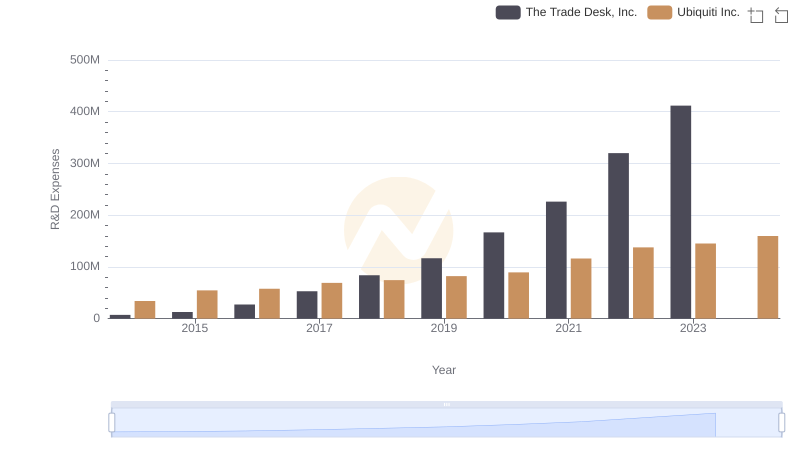
Analyzing R&D Budgets: The Trade Desk, Inc. vs Ubiquiti Inc.
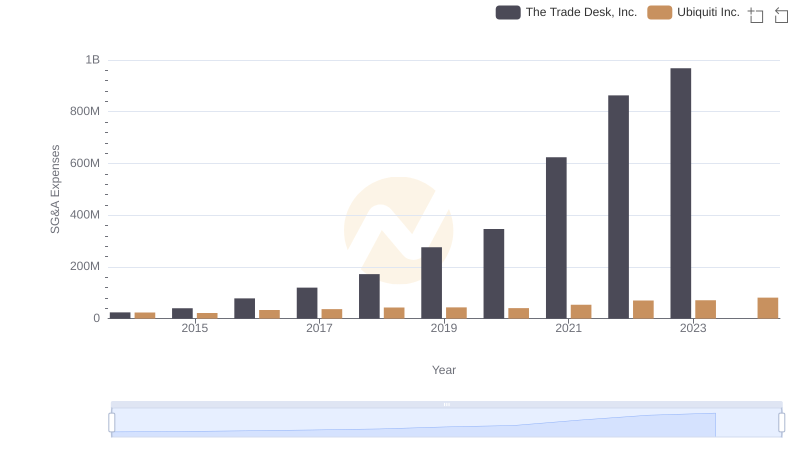
SG&A Efficiency Analysis: Comparing The Trade Desk, Inc. and Ubiquiti Inc.