| __timestamp | Corning Incorporated | Fortinet, Inc. |
|---|---|---|
| Wednesday, January 1, 2014 | 1211000000 | 357151000 |
| Thursday, January 1, 2015 | 1523000000 | 541885000 |
| Friday, January 1, 2016 | 1472000000 | 707581000 |
| Sunday, January 1, 2017 | 1467000000 | 788888000 |
| Monday, January 1, 2018 | 1799000000 | 875300000 |
| Tuesday, January 1, 2019 | 1585000000 | 1029000000 |
| Wednesday, January 1, 2020 | 1747000000 | 1191400000 |
| Friday, January 1, 2021 | 1827000000 | 1489200000 |
| Saturday, January 1, 2022 | 1898000000 | 1855100000 |
| Sunday, January 1, 2023 | 1843000000 | 2217300000 |
| Monday, January 1, 2024 | 1931000000 | 2282600000 |
Igniting the spark of knowledge
In the ever-evolving landscape of corporate finance, understanding the efficiency of Selling, General, and Administrative (SG&A) expenses is crucial. Over the past decade, Fortinet, Inc. and Corning Incorporated have showcased contrasting trajectories in their SG&A expenditures.
From 2014 to 2023, Corning's SG&A expenses grew by approximately 52%, peaking in 2022. Meanwhile, Fortinet's expenses surged by over 520%, reflecting its aggressive growth strategy. By 2023, Fortinet's SG&A expenses surpassed Corning's, highlighting its rapid expansion.
This analysis underscores the strategic differences between a tech giant like Fortinet, focusing on scaling operations, and a manufacturing stalwart like Corning, maintaining steady growth. Investors and analysts should consider these trends when evaluating the operational efficiency and strategic direction of these companies.
Understanding these dynamics offers valuable insights into how companies allocate resources to drive growth and maintain competitive advantage.
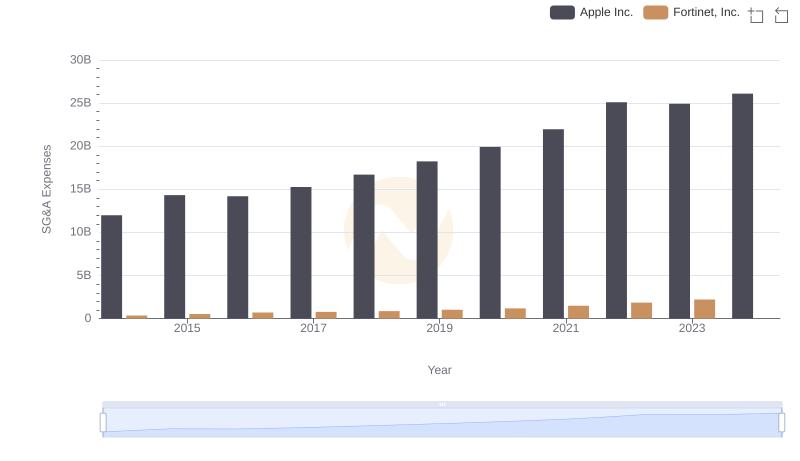
Apple Inc. and Fortinet, Inc.: SG&A Spending Patterns Compared
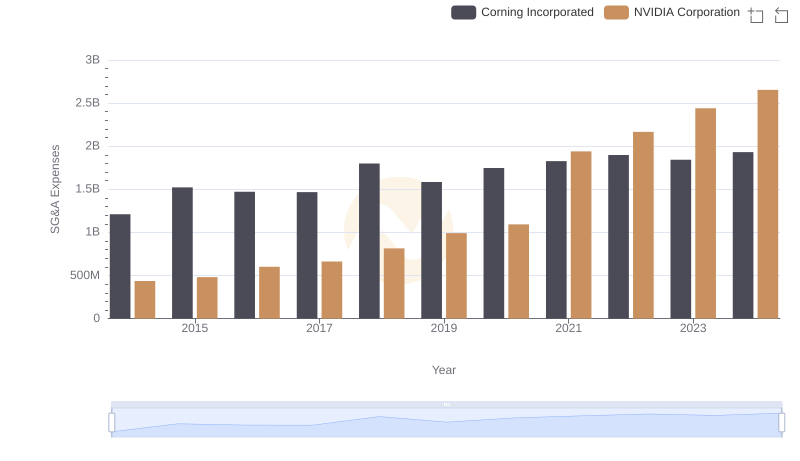
NVIDIA Corporation or Corning Incorporated: Who Manages SG&A Costs Better?
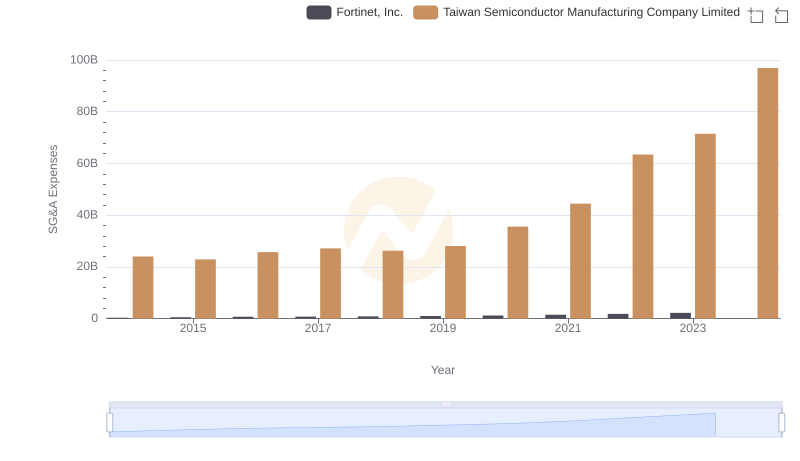
Who Optimizes SG&A Costs Better? Taiwan Semiconductor Manufacturing Company Limited or Fortinet, Inc.
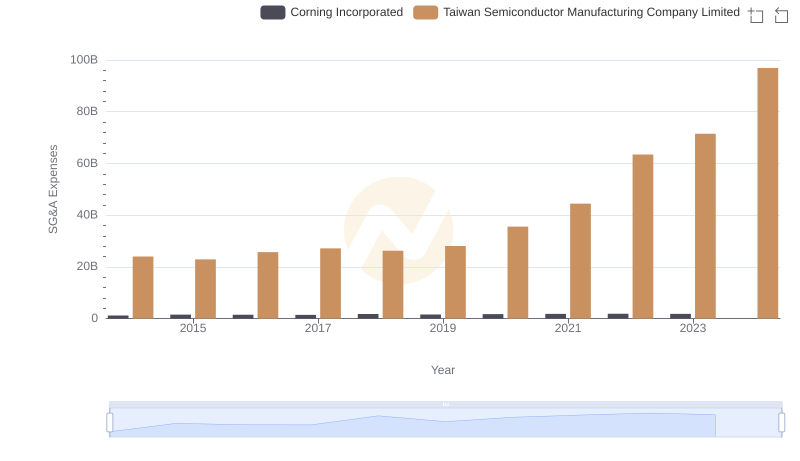
Operational Costs Compared: SG&A Analysis of Taiwan Semiconductor Manufacturing Company Limited and Corning Incorporated
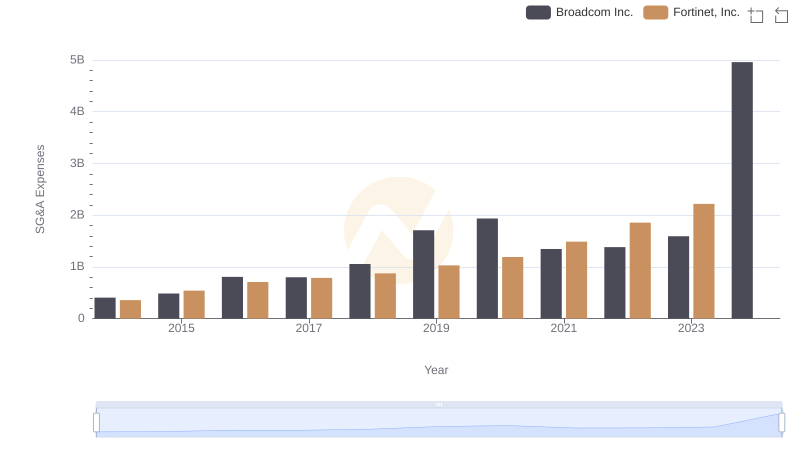
Breaking Down SG&A Expenses: Broadcom Inc. vs Fortinet, Inc.
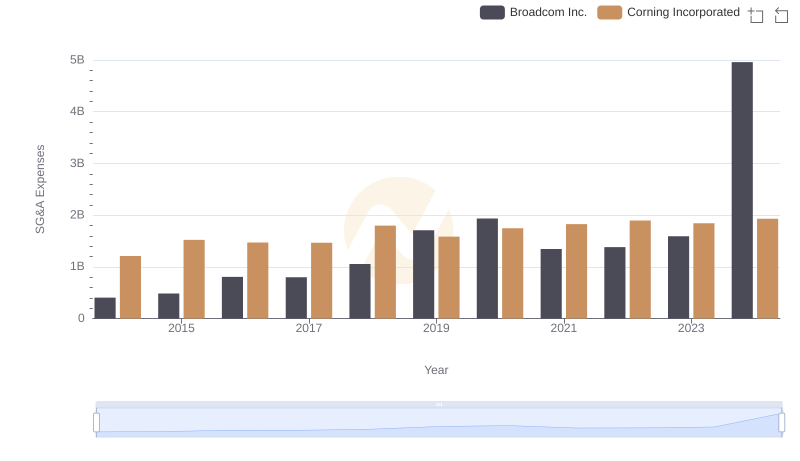
Breaking Down SG&A Expenses: Broadcom Inc. vs Corning Incorporated
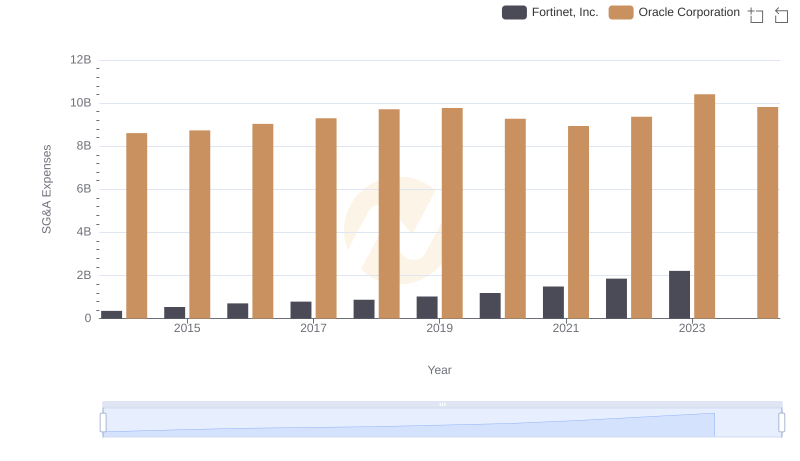
SG&A Efficiency Analysis: Comparing Oracle Corporation and Fortinet, Inc.
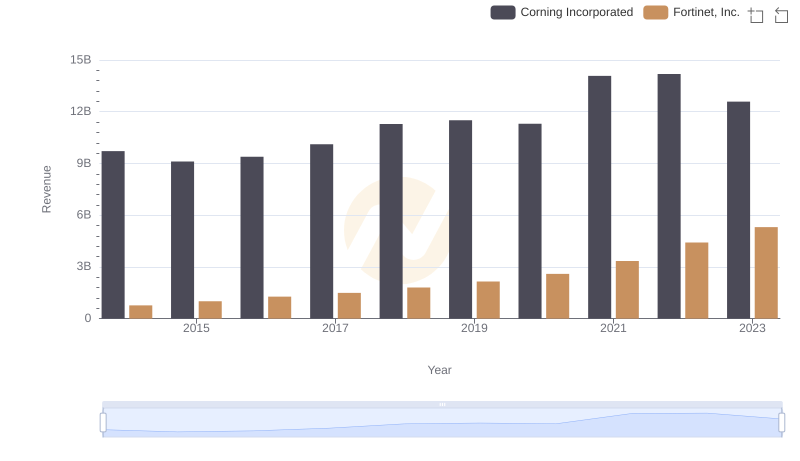
Fortinet, Inc. vs Corning Incorporated: Examining Key Revenue Metrics
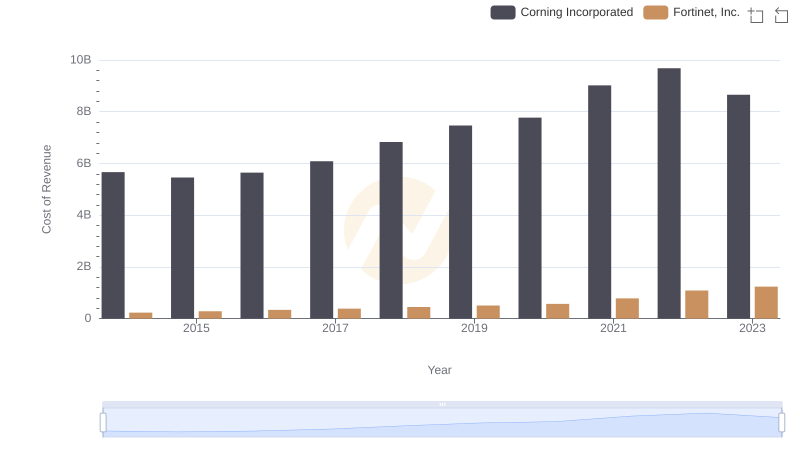
Cost of Revenue Comparison: Fortinet, Inc. vs Corning Incorporated
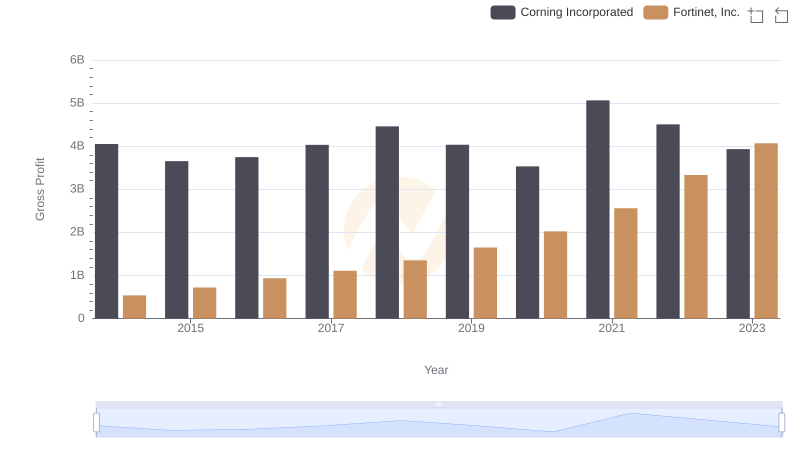
Gross Profit Trends Compared: Fortinet, Inc. vs Corning Incorporated
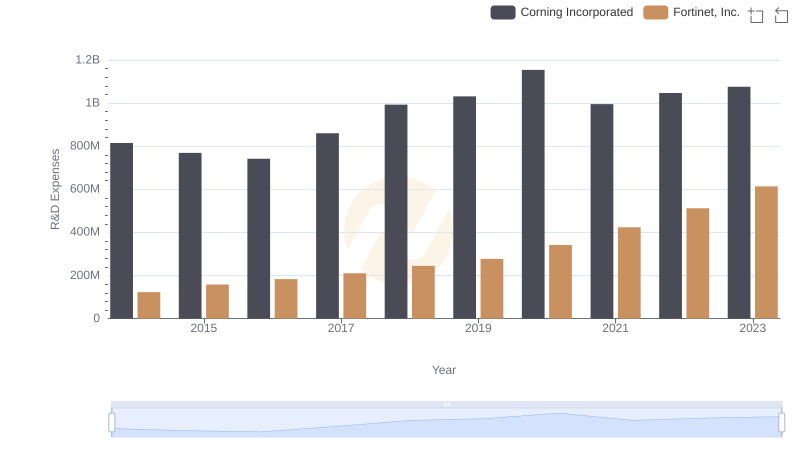
R&D Spending Showdown: Fortinet, Inc. vs Corning Incorporated
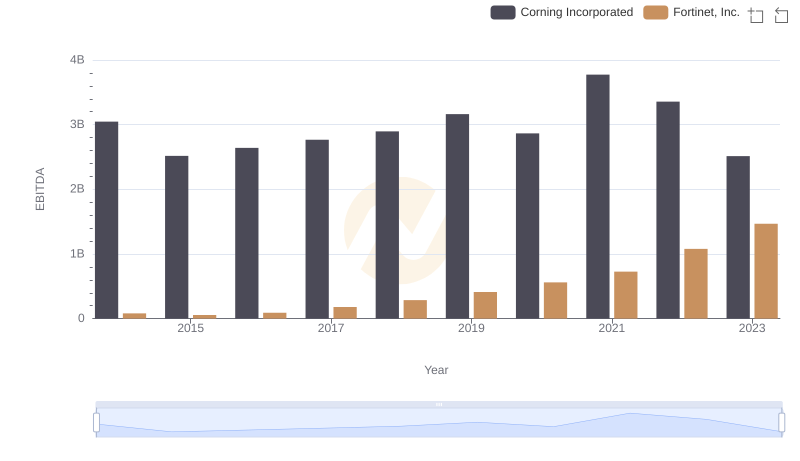
Comprehensive EBITDA Comparison: Fortinet, Inc. vs Corning Incorporated