| __timestamp | Corning Incorporated | Fortinet, Inc. |
|---|---|---|
| Wednesday, January 1, 2014 | 4052000000 | 539355000 |
| Thursday, January 1, 2015 | 3653000000 | 722491000 |
| Friday, January 1, 2016 | 3746000000 | 937606000 |
| Sunday, January 1, 2017 | 4032000000 | 1109646000 |
| Monday, January 1, 2018 | 4461000000 | 1350800000 |
| Tuesday, January 1, 2019 | 4035000000 | 1650300000 |
| Wednesday, January 1, 2020 | 3531000000 | 2024400000 |
| Friday, January 1, 2021 | 5063000000 | 2559200000 |
| Saturday, January 1, 2022 | 4506000000 | 3332500000 |
| Sunday, January 1, 2023 | 3931000000 | 4067600000 |
| Monday, January 1, 2024 | 4276000000 | 4798200000 |
Data in motion
In the ever-evolving landscape of technology and manufacturing, Fortinet, Inc. and Corning Incorporated stand as titans in their respective fields. Over the past decade, from 2014 to 2023, these companies have showcased distinct trajectories in their gross profit trends.
Fortinet, a leader in cybersecurity, has seen its gross profit skyrocket by over 650% from 2014 to 2023. This impressive growth reflects the increasing global demand for robust digital security solutions. By 2023, Fortinet's gross profit reached approximately $4.07 billion, marking a significant milestone in its financial journey.
Conversely, Corning, renowned for its innovations in glass and ceramics, experienced a more stable yet fluctuating trend. Despite a dip in 2020, Corning's gross profit peaked in 2021 at around $5.06 billion, before settling at $3.93 billion in 2023. This reflects the company's resilience amidst global economic challenges.
These trends highlight the dynamic nature of industry-specific growth and the strategic maneuvers companies must employ to thrive.
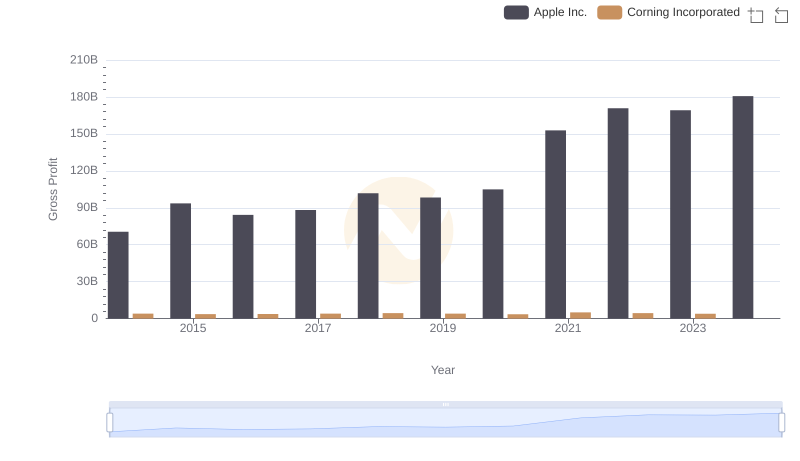
Key Insights on Gross Profit: Apple Inc. vs Corning Incorporated
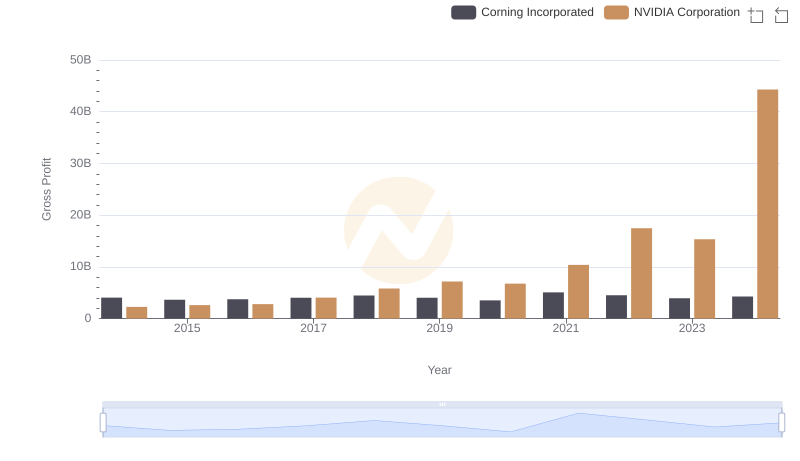
Who Generates Higher Gross Profit? NVIDIA Corporation or Corning Incorporated
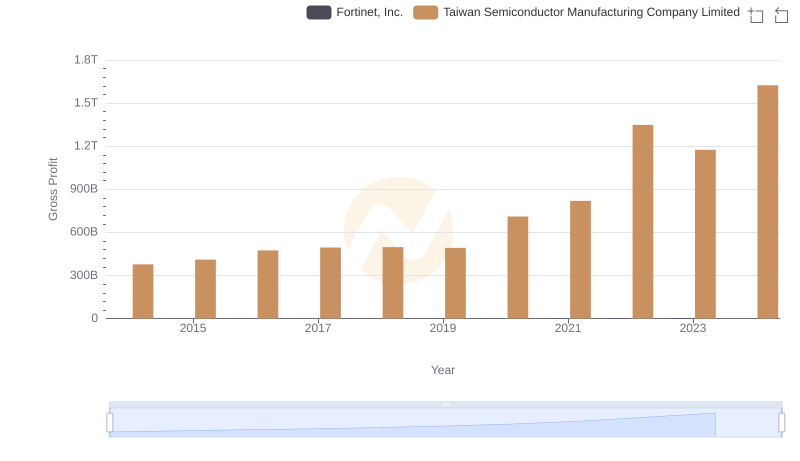
Gross Profit Comparison: Taiwan Semiconductor Manufacturing Company Limited and Fortinet, Inc. Trends
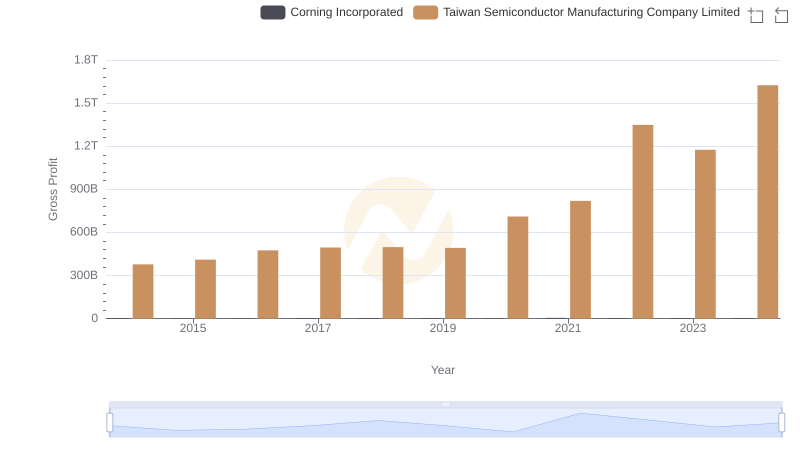
Taiwan Semiconductor Manufacturing Company Limited vs Corning Incorporated: A Gross Profit Performance Breakdown
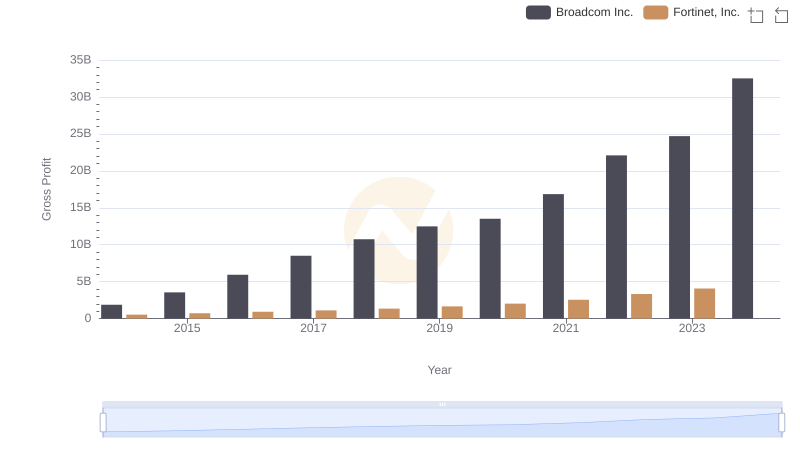
Broadcom Inc. vs Fortinet, Inc.: A Gross Profit Performance Breakdown
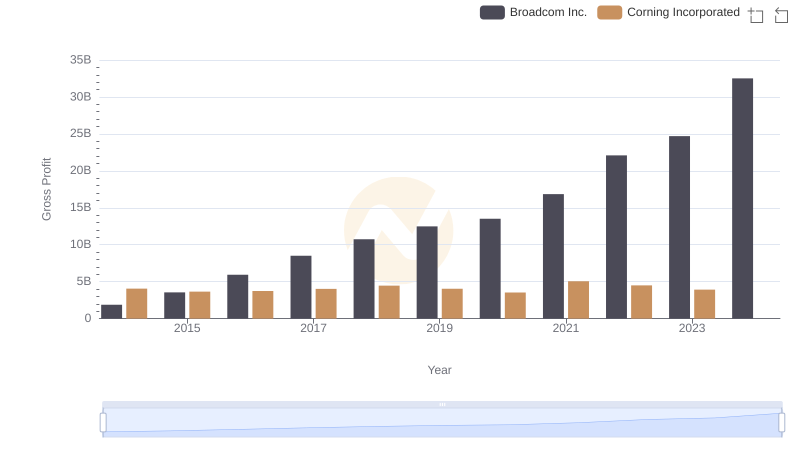
Gross Profit Analysis: Comparing Broadcom Inc. and Corning Incorporated
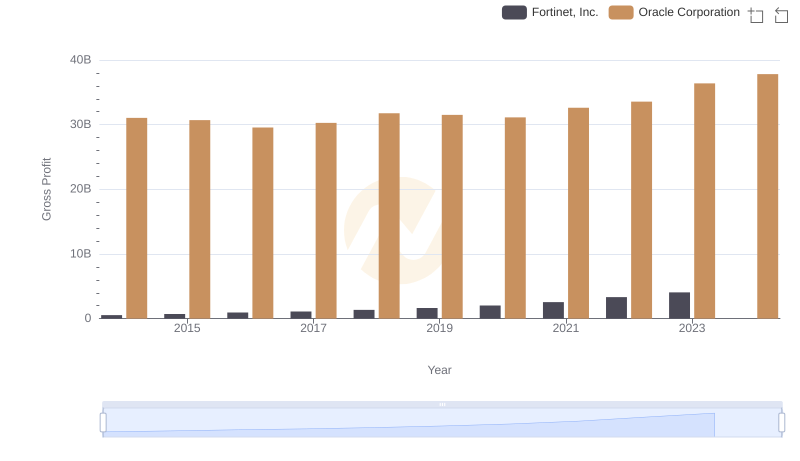
Who Generates Higher Gross Profit? Oracle Corporation or Fortinet, Inc.
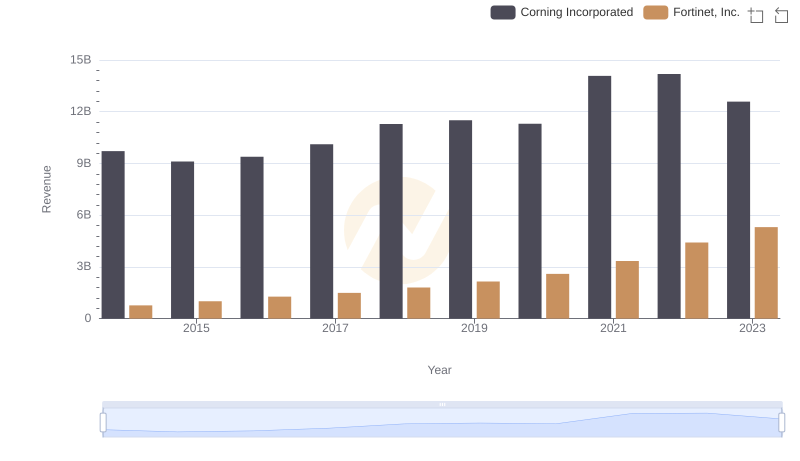
Fortinet, Inc. vs Corning Incorporated: Examining Key Revenue Metrics
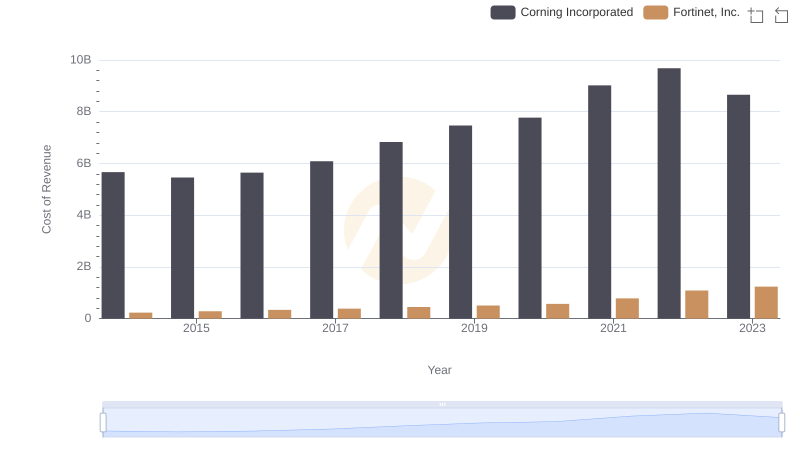
Cost of Revenue Comparison: Fortinet, Inc. vs Corning Incorporated
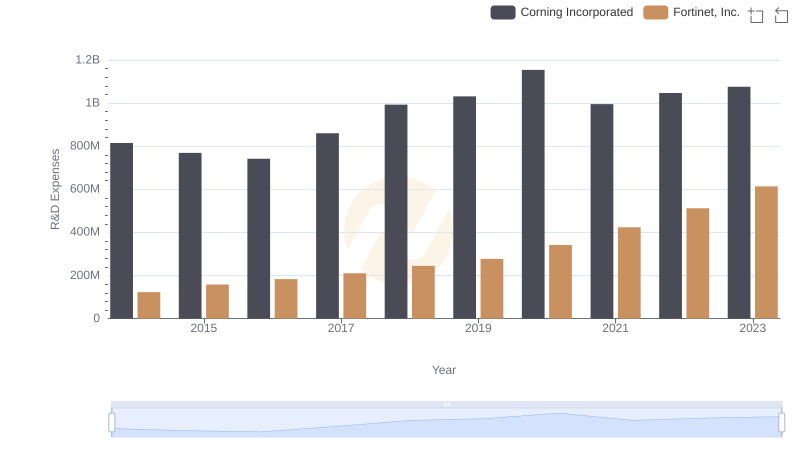
R&D Spending Showdown: Fortinet, Inc. vs Corning Incorporated
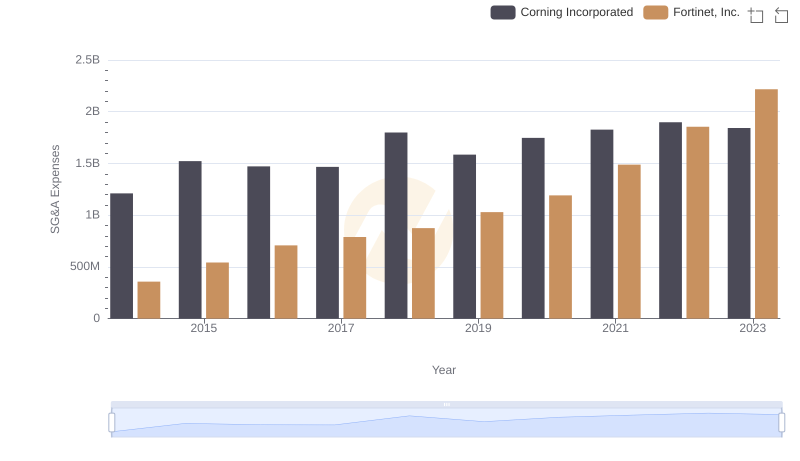
SG&A Efficiency Analysis: Comparing Fortinet, Inc. and Corning Incorporated
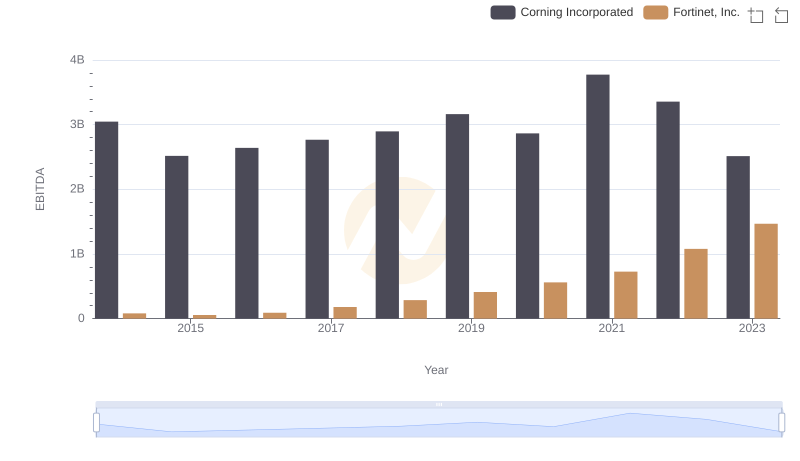
Comprehensive EBITDA Comparison: Fortinet, Inc. vs Corning Incorporated