| __timestamp | Corning Incorporated | Fortinet, Inc. |
|---|---|---|
| Wednesday, January 1, 2014 | 9715000000 | 770364000 |
| Thursday, January 1, 2015 | 9111000000 | 1009268000 |
| Friday, January 1, 2016 | 9390000000 | 1275443000 |
| Sunday, January 1, 2017 | 10116000000 | 1494930000 |
| Monday, January 1, 2018 | 11290000000 | 1801200000 |
| Tuesday, January 1, 2019 | 11503000000 | 2156200000 |
| Wednesday, January 1, 2020 | 11303000000 | 2594400000 |
| Friday, January 1, 2021 | 14082000000 | 3342200000 |
| Saturday, January 1, 2022 | 14189000000 | 4417400000 |
| Sunday, January 1, 2023 | 12588000000 | 5304800000 |
| Monday, January 1, 2024 | 13118000000 | 5955800000 |
Data in motion
In the ever-evolving landscape of technology and innovation, Fortinet, Inc. and Corning Incorporated stand as titans in their respective fields. Over the past decade, these companies have showcased remarkable growth trajectories, albeit in different magnitudes.
From 2014 to 2023, Corning Incorporated, a leader in materials science, has consistently maintained a robust revenue stream, peaking in 2022 with a 42% increase from its 2014 figures. Meanwhile, Fortinet, Inc., a cybersecurity powerhouse, has experienced a meteoric rise, with its revenue surging by an impressive 589% over the same period.
This comparison not only highlights the dynamic nature of the tech industry but also underscores the diverse strategies employed by these companies to capture market share. As we look to the future, the question remains: how will these giants continue to innovate and adapt in an ever-competitive market?
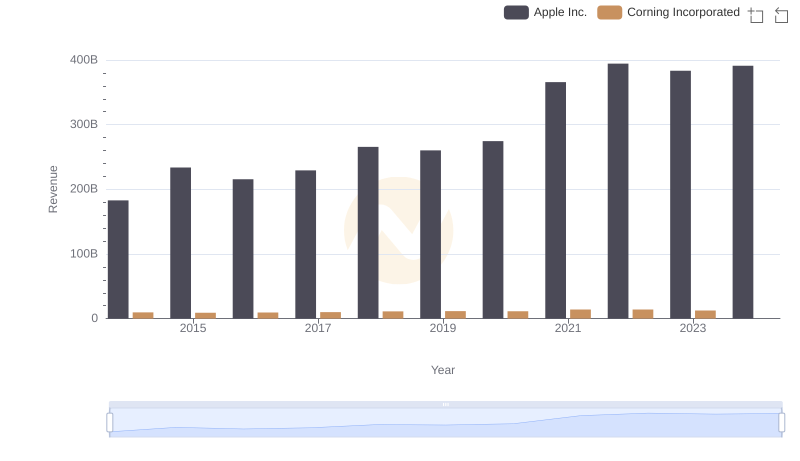
Annual Revenue Comparison: Apple Inc. vs Corning Incorporated
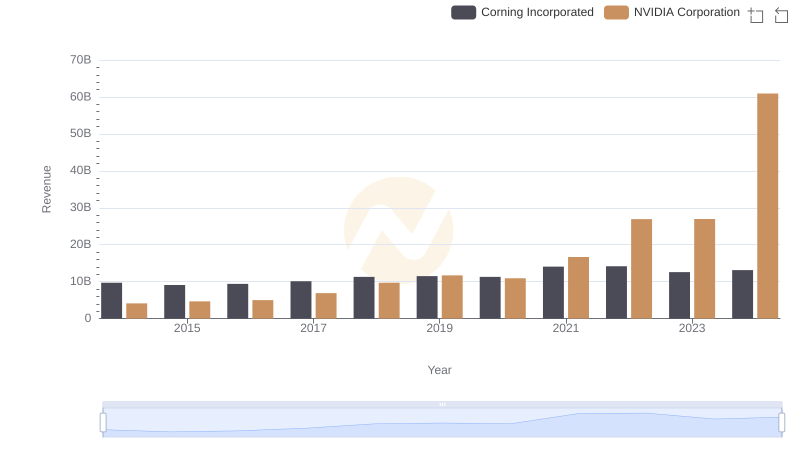
Revenue Showdown: NVIDIA Corporation vs Corning Incorporated
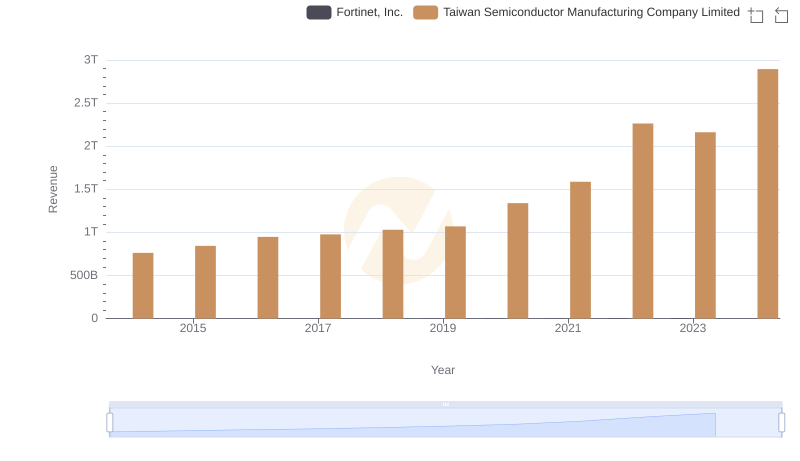
Revenue Showdown: Taiwan Semiconductor Manufacturing Company Limited vs Fortinet, Inc.

Breaking Down Revenue Trends: Taiwan Semiconductor Manufacturing Company Limited vs Corning Incorporated
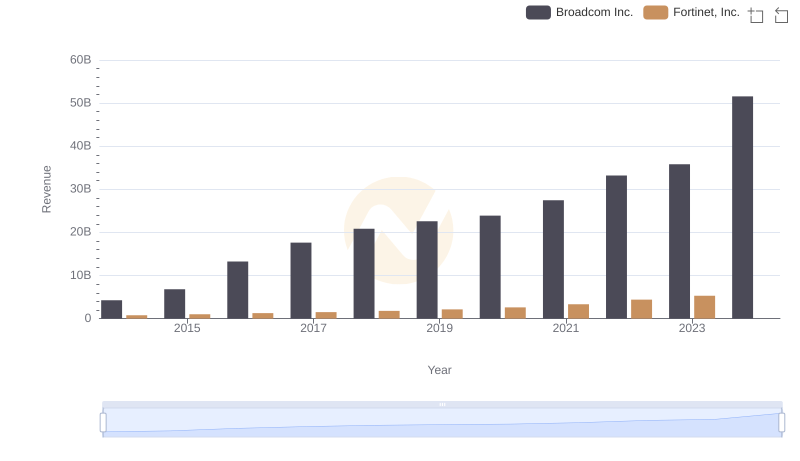
Revenue Showdown: Broadcom Inc. vs Fortinet, Inc.
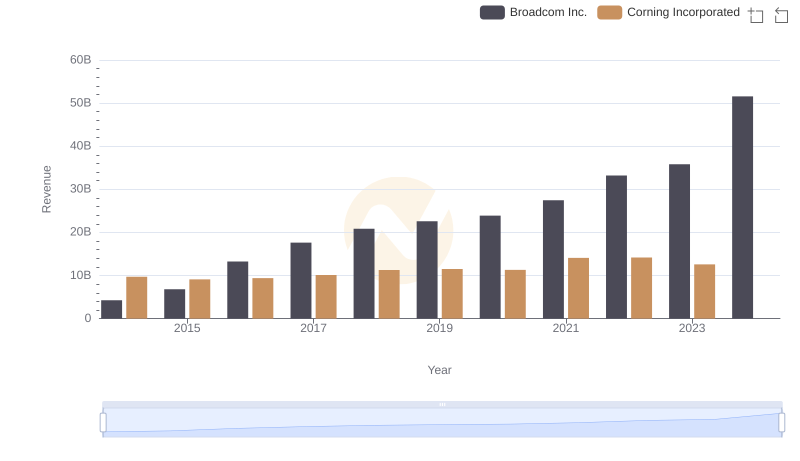
Annual Revenue Comparison: Broadcom Inc. vs Corning Incorporated
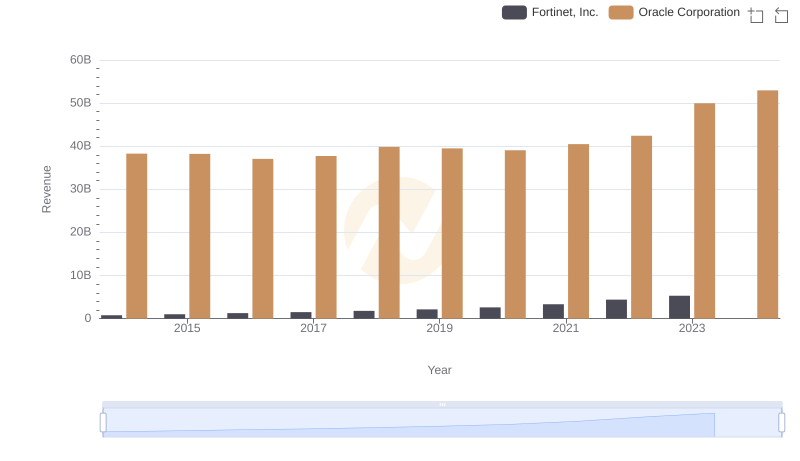
Oracle Corporation and Fortinet, Inc.: A Comprehensive Revenue Analysis
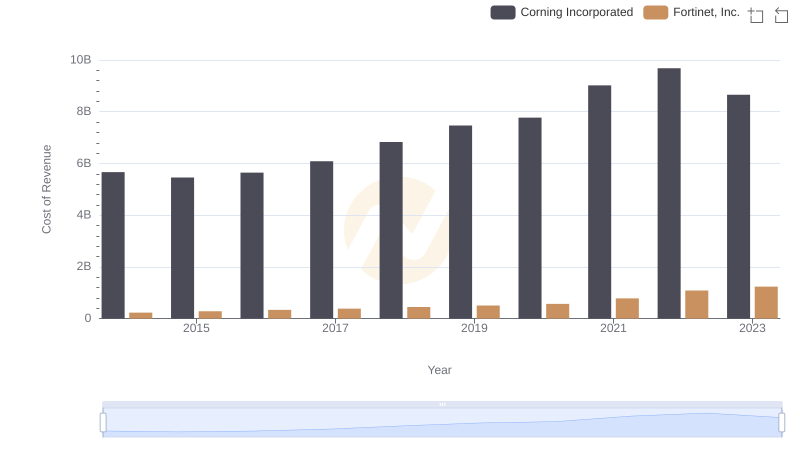
Cost of Revenue Comparison: Fortinet, Inc. vs Corning Incorporated
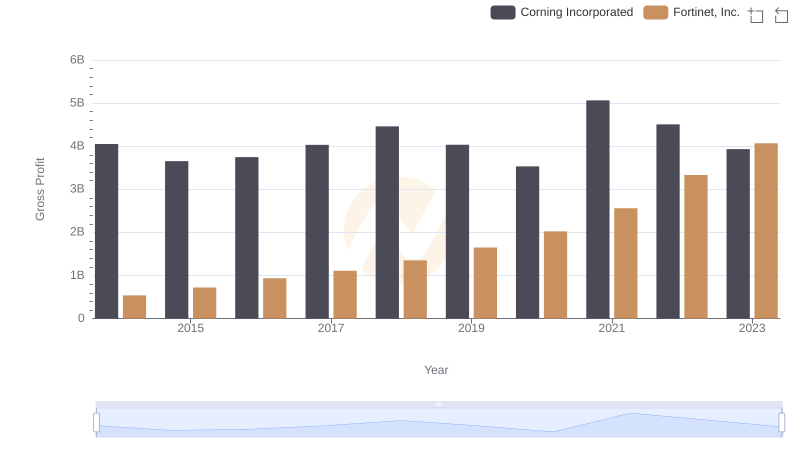
Gross Profit Trends Compared: Fortinet, Inc. vs Corning Incorporated
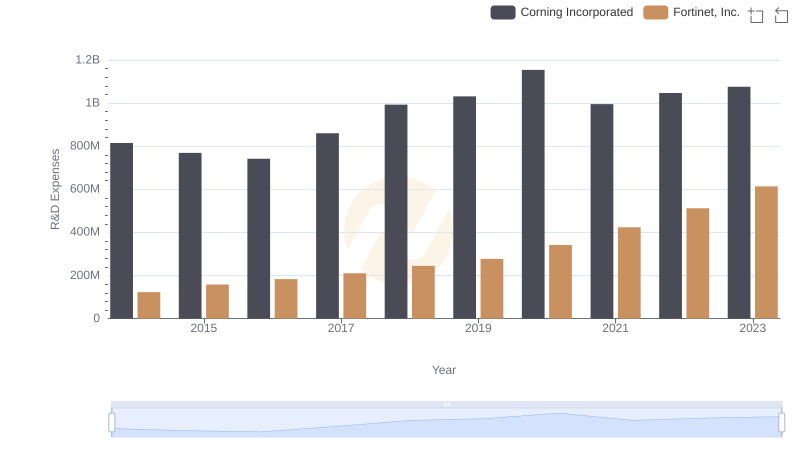
R&D Spending Showdown: Fortinet, Inc. vs Corning Incorporated
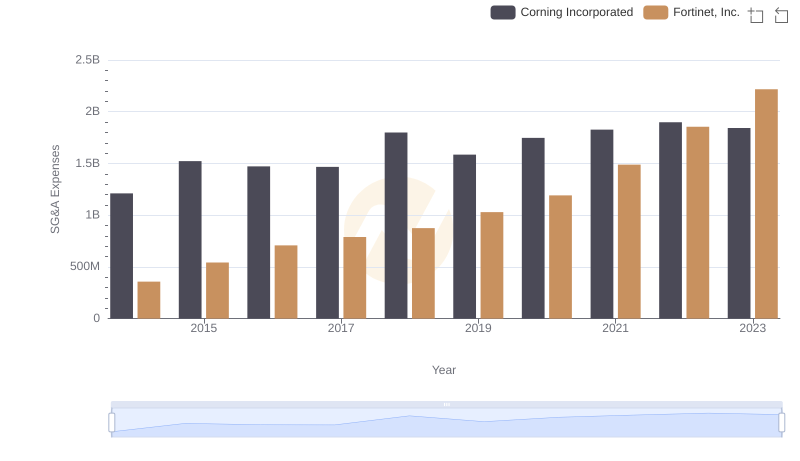
SG&A Efficiency Analysis: Comparing Fortinet, Inc. and Corning Incorporated
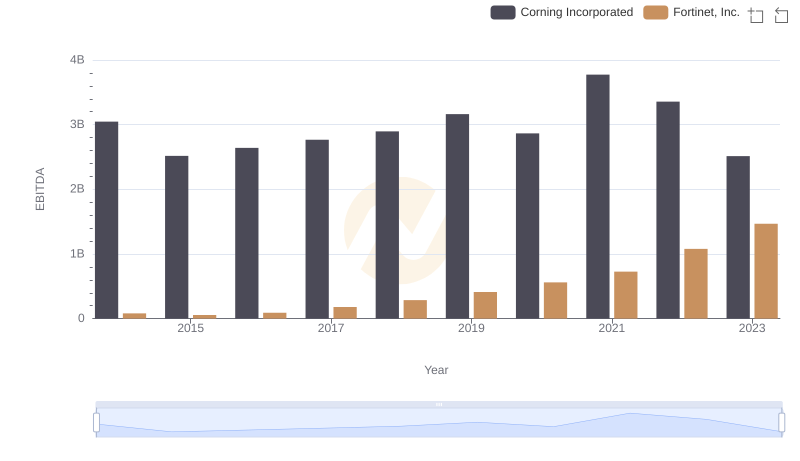
Comprehensive EBITDA Comparison: Fortinet, Inc. vs Corning Incorporated